WEG – Earning release 3Q 2026


Return of revenue growth, especially in the external market, and healthy operating margins
Highlights
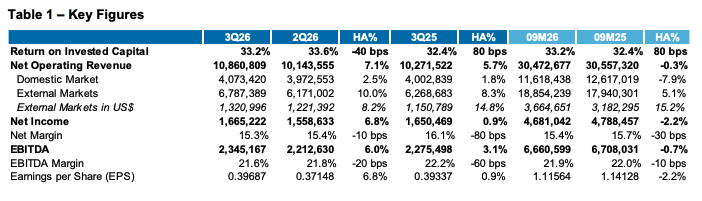
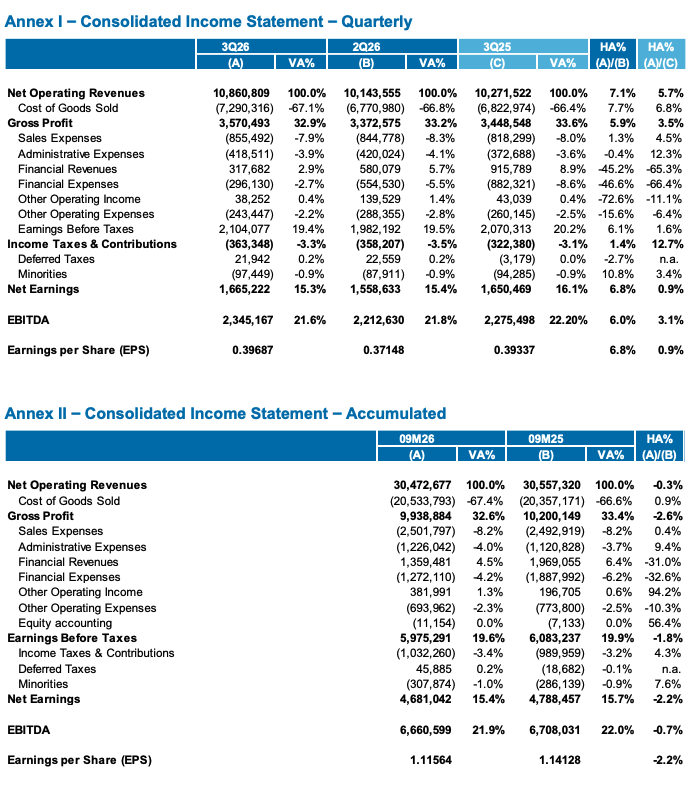
- Net Operating Revenue (NOR) was R$ 10,860.8 million in 3Q26, 5.7% higher than 3Q25 and 7.1% higher than 2Q26.
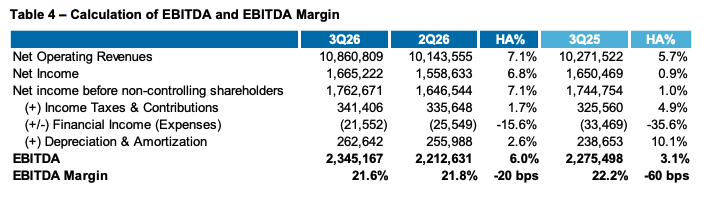
- EBITDA(1) reached R$ 2,345.2 million, 3.1% higher than 3Q25 and 6.0% higher than 2Q26, while EBITDA margin was 21.6%, 60 bps lower than 3Q25 and 20 bps lower than the previous quarter.
- Return on Invested Capital (ROIC) reached 33.2% in 3Q26, up 80 bps from 3Q25 and down 40 bps from 2Q26.
Message from Management
The revenue growth and maintenance of healthy operating margins were driven by the good performance of businesses in the external market, sustained by good demand for products and services in the main operating segments, despite the impact of the appreciation of the Brazilian real during the period.
In Brazil, we returned to growth compared to the same period of last year, mainly due to the continued deliveries of long-cycle projects, with highlights for transmission & distribution (T&D) and automation systems business. At the same time, we continued to report lower revenue in the solar generation business due to lower demand for distributed solar generation (GD), combined with the lack of new centralized solar generation (GC) projects.
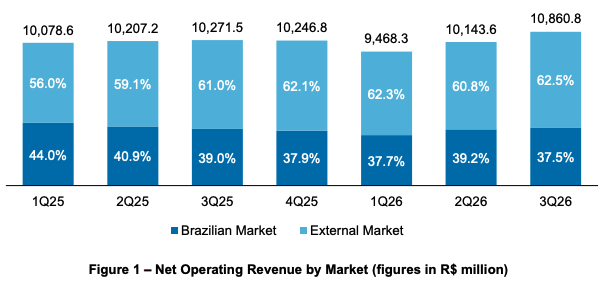
In the external market, we posted another quarter of growth, reaching 62.5% of total revenue, the highest level recorded in WEG’s history, despite the impact of exchange rate volatility of the Brazilian reais. We continued with a good level of deliveries in the Energy Generation, Transmission and Distribution (GTD) area, mainly in North America, both in the T&D business and in the growing demand for generators. The Industrial Electro-Electronic Equipment (EEI) area also contributed to the growth, showing continued demand for our products and services in the main markets, with highlights for the oil & gas segment and ventilation and refrigeration systems.
We remain confident in our model of products and solutions diversification, operational flexibility, and global presence, which allows us to seize the opportunities present in different operating markets. We continue our capacity expansion strategy, with focus on executing the announced projects, which combined with the constant pursuit of operational efficiency, are fundamental to supporting the Company’s continuous and sustainable growth.
The following financial and operating data are presented on a consolidated basis, except when otherwise indicated, in thousands of Brazilian reais (R$) according to accounting practices adopted in Brazil, including Brazilian Corporate Law in convergence with IFRS international norms. Except when otherwise indicated, growth rates and other comparisons are made to the same period of the previous year. Share data is adjusted for split or bonus events.
Net Operating Revenue
Net Operating Revenue was 5.7% higher compared to 3Q25, growth 1.8% in the domestic market and 8.3% in the external market. Adjusted for the consolidation effects of the acquired businesses from Tupinambá Energia and Sanelec, revenue for the quarter would have increased 5.6% over 3Q25.
The evolution of revenue proportion between markets is shown in Figure 1.
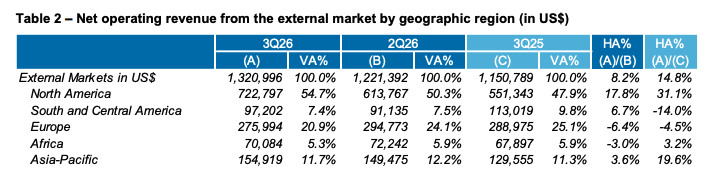
Net operating revenue from the external market, measured in quarterly averaged US dollars (US$), increased by 14.8% compared to 3Q25 and increased by 8.2% compared to 2Q26. The distribution of net revenue by geographic market is shown in Table 2.
Net operating revenue from the external market was negatively impacted by the average US dollar exchange rate that moved from R$ 5.45 in 3Q25 to R$ 5.14 in 3Q26, a 5.7% depreciation over the Brazilian real.
It is important to consider that sales prices in different markets are set in local currency and according to their competitive conditions. Measured in local currencies, weighted by revenues in each market and adjusted for the consolidation effects of acquired businesses, net operating revenue from the external market increased by 13.4%(2) compared to 3Q25.
Performance by Business Area
Industrial Electro-Electronic Equipment (EEI)
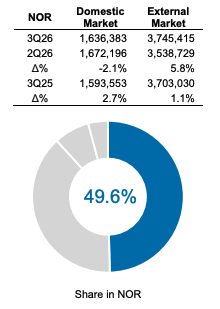
Domestic Market
- Softer demand for short-cycle goods, reflecting lower industrial activity observed across different segments of operation, with the postponement of larger-scale investments and an increased focus on maintenance.
- Long-cycle goods, particularly automation panels, recorded strong delivery volume, reflecting the order backlog accumulated in recent quarters, especially in the pulp & paper segment.
External Market
- Demand remained good for short-cycle goods, such as low-voltage electric motors and serial automation products, despite the negative impact of the devaluation of the US dollar during the period. Highlights for the oil & gas, mining, and data center cooling systems segments.
- Positive contribution from long-cycle goods, such as high-voltage motors and automation panels, in addition to a good order intake, supporting a healthy order backlog for the coming quarters.
Energy Generation, Transmission, and Distribution (GTD)
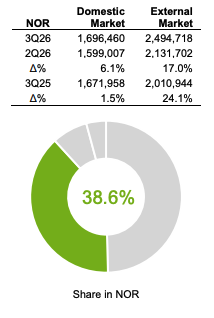
Domestic Market
- The T&D business posted another positive quarter, driven by transformer deliveries to transmission auction projects and for distribution networks. Operations at the expanded Betim / MG plant began this quarter, increasing production capacity for large transformers.
- In the generation businesses, despite the solar GC comparison basis normalization, revenue was still negatively impacted by the demand accommodation in the solar DG business, when compared to the same period of the previous year.
External Market
- Opportunities in the T&D market in North America continue to contribute to the growth of the business, especially in transformers for the electrical grid infrastructure in the US, along with good demand in most operating markets.
- The generation businesses continue to demonstrate positive momentum, highlighted by the strong performance of Marathon’s generator business in the US, which primarily provides backup power for data centers, as well as the positive contribution from the operation in Europe.
Commercial and Appliance Motors (MCA)
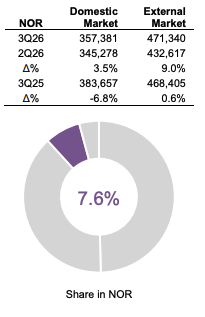
Domestic Market
- In Brazil, even with positive demand in the washing machine segment, demand volatility in some important segments, especially air conditioning motors, impacted growth in the quarter.
External Market
- Good performance of operations in North America and continued growth compared to 2Q26, despite revenue growth compared to the previous year being impacted by currency fluctuations during the period.
Paints and Varnishes (T&V)
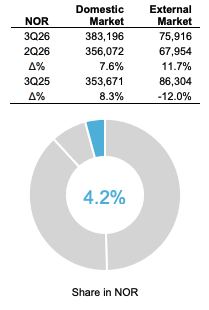
Domestic Market
- Demand remained strong, with highlights for the good sales volume of liquid paints for the oil & gas segment.
External Market
- Decrease in revenue in the external market, compared to the same period of the previous year, with accommodation in demand in relevant segments such as oil & gas, in addition to the impact of currency fluctuations during the period.
Cost of Goods Sold
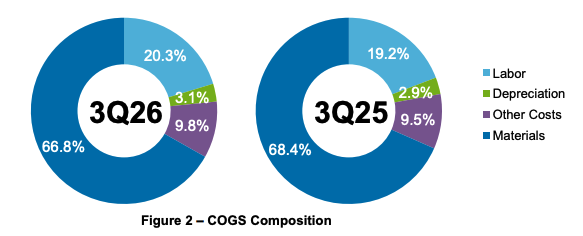
The Cost of Goods Sold (COGS) and gross margin for the quarter are shown in Table 3.

The gross margin movement is mainly explained by the cost increase in important raw materials, especially copper, in addition to the variation and increase in import tariffs to the US. Labor expenses remain at a higher level, justified by the ongoing expansion of production capacity since the beginning of this year. Despite the movements observed, efforts to reduce costs and continuously improve processes, promoting structural productivity gains, continue to be a constant focus of the Company.
Sales, General, and Administrative Expenses
Consolidated Sales, General and Administrative (SG&A) expenses totaled R$ 1,274.0 million in 3Q26, an increase of 7.0% vs. 3Q25 and 0.7% vs. 2Q26. When analyzed relative to net operating revenue, it represented 11.7%, down 10 bps from 3Q25 and down 80 bps from 2Q26.
EBITDA and EBITDA Margin
The composition of the EBITDA calculation, according to Resolution CVM 156/2022, and the EBITDA margin are shown in Table 4. The EBITDA margin remains healthy, due to the current mix of products sold, despite the slight accommodation when compared to the same period of the previous year, mainly impacted by the afore mentioned movements in costs.
Net Income
Net Income in 3Q26 was R$ 1,665.2 million, an increase of 0.9% compared to 3Q25 and an increase of 6.8% compared to 2Q26. The net margin reached 15.3%, 80 bps lower than 3Q25 and 10 bps lower than 2Q26.
Cash Flow
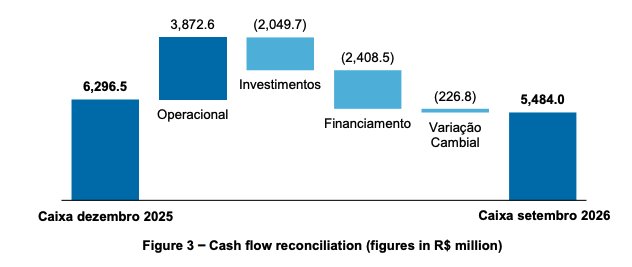
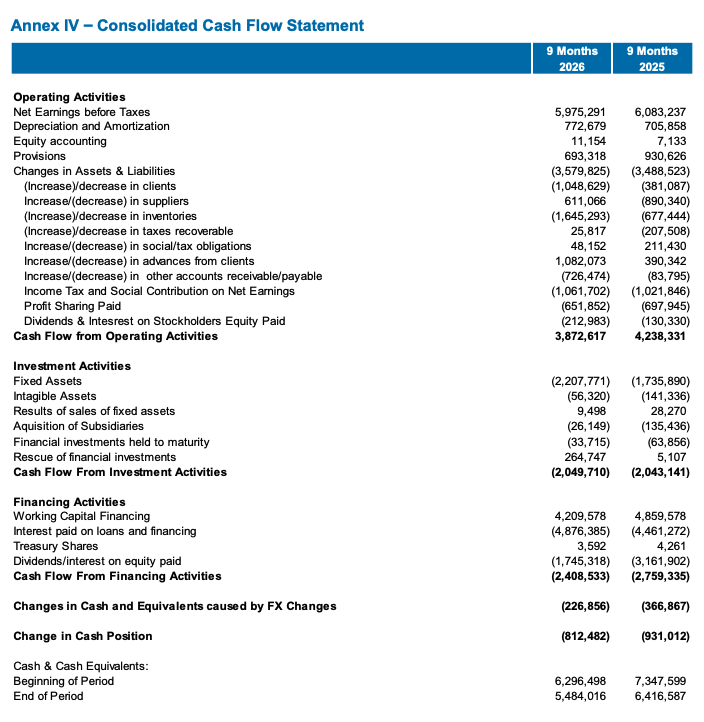
Cash generation from operating activities was R$ 3,872.6 million as of September 2026, driven by continued strong operating margins and good operational working capital indicators during the period.
Investment activities, which include changes in fixed and intangible assets, acquisitions and financial investments, totaled R$ 2,049.7 million. The level of CAPEX(3) in modernization and expansion of production capacity continued through the investments in factories in Brazil, Mexico, Colombia, the US and China.
In financing activities, the Company raised R$ 4,209.6 million and made amortizations of R$ 4,876.4 million, resulting in a net amortization of R$ 666.8 million. Payments to equity holders (dividends and interest on capital) totaled R$ 1,745,3 million The result was a consumption of R$ 2,408.5 million in financing activities in the period.
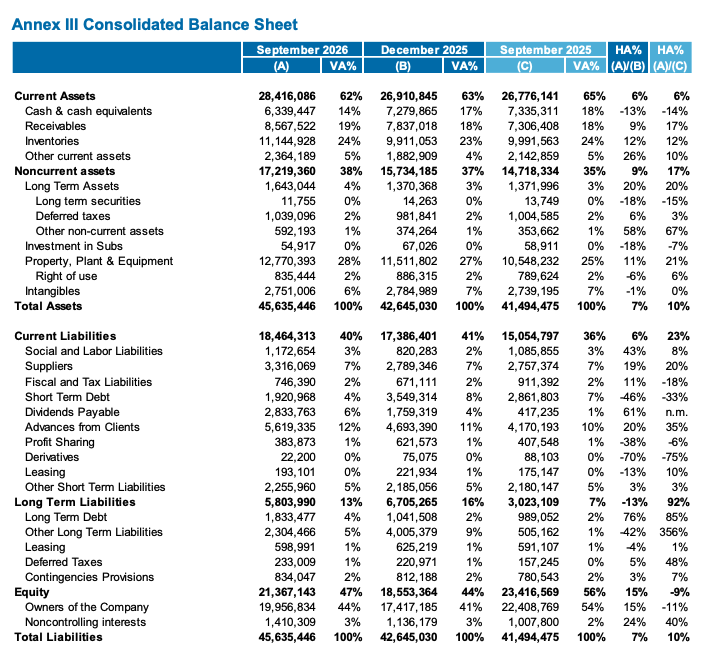
Note that the chart in Figure 3 shows the cash and cash equivalents position classified as current assets. Furthermore, the Company has R$ 891.9 million in financial investments with no immediate liquidity, including derivative financial instruments (R$ 1,022.8 million in December 2025).
Return on Invested Capital
The ROIC for 3Q26, accumulated over the last 12 months, reached 33.2%, up 80 bps from 3Q25 and down 40 bps from 2Q26. The good level of Net Operating Profit after Taxes (NOPAT), more than offset the current levels of capital employed, primarily driven by investments in fixed and intangible assets made over the last 12 months.
Investments (CAPEX)
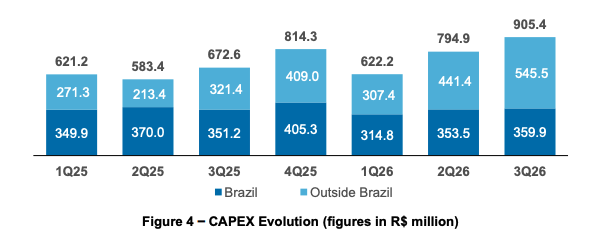
In 3Q26, investments of R$ 905.4 million in the modernization and expansion of production capacity, machinery and equipment and software licenses, 39.8% of which went to production units in Brazil and 60.2% to industrial plants and other facilities abroad.
In Brazil, investments continued in the expansion of T&D production capacity, the production capacity increase for large equipment in Jaraguá do Sul and Guaramirim, and vertical integration investments in Linhares. Outside Brazil, progress was made at transformer factories in Mexico, Colombia and the US, as well as in expanding production capacity for high-voltage motors in China.
Research, Development, and Innovation
Expenditures on research, development and innovation activities totaled R$ 1,131.4 million, representing 3.7% of accumulated net operating revenue in 2026.
Debt and Cash Position
Cash, cash equivalents, invested in first-tier banks and denominated in Brazilian currency, and financial investments and derivatives are presented in Table 5. Likewise, the Company presents the total gross financial debt, with details between short and long-term, in Brazilian reais and other currencies, resulting in the Company’s net cash at the end of the quarter.
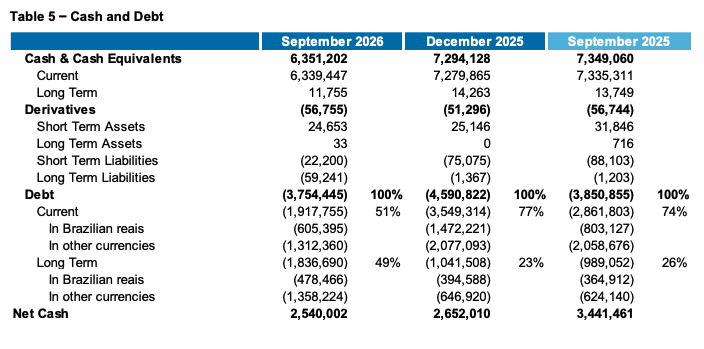
The total duration of our indebtedness was 19.9 months in September 2026 (13.0 months in December 2025).
Dividends and Interest on Stockholders’ Equity
The Board of Directors approved ad referendum of the Annual General Meeting (AGM), the events presented in Table 6 as remuneration to shareholders:

Additionally, on December 19, 2025, the Extraordinary General Meeting approved the establishment and payment of dividends calculated on the balance of Profit Reserves, in the amount of R$ 5,196.3 million, recorded in the Equity of the Interim Financial Statements, disclosed and audited as of September 30, 2025. These dividends will be paid in three annual installments, in August 2026, 2027, and 2028, in accordance with the Shareholders’ Notice disclosed on December 19, 2025. The first installment, totaling R$ 1,732,116,188.37, equivalent to R$ 0.412831673 per share, was paid on August 12, 2026, to the shareholders of record on December 19, 2025.
Results Conference Call
On October 22, 2026 (Thursday), WEG will hold a teleconference in Portuguese, with simultaneous translation into English, also available on the internet webcast, at the following times:
- 11:00 a.m. – São Paulo (BRT)
- 10:00 a.m. – New York (EDT)
- 3:00 p.m. – London (BST)
Access Link: click here
The presentation will also be available on our Investor Relations website (ir.weg.net).
Forward-Looking Statements
The statements contained in this report relating to WEG’s business prospects, projections, results and growth potential constitute mere forecasts and are based on management’s expectations regarding WEG’s future. These expectations are highly dependent on changes in the market, the country’s overall economic performance, industry performance and international markets, and are subject to change.
FINANCIAL STATEMENTS
3Q 2026 Annexes
Notes:
(1) Earnings before Interest, Taxes, Depreciation, and Amortization.
(2) Variations in countries with hyperinflation and acquisitions in the period are not considered.
(3) Capital Expenditure. n.a. stands for not applicable. n.m. stands for not mentioned. bps stands for basis points.
SourceWEG
EMR Analysis
More information on WEG: See the full profile on EMR Executive Services
More information on Alberto Yoshikazu Kuba (Executive President, WEG Group): See the full profile on EMR Executive Services
More information on André Luís Rodrigues (Vice President, Administrative and Financial, WEG Group): See the full profile on EMR Executive Services
More information on Marathon Electric by WEG: See the full profile on EMR Executive Services
More information on Tupinambá Energia by WEG: See the full profile on EMR Executive Services
More information on Davi Bertoncello (Founder and Executive Director, Tupinambá Energia, WEG Group): See the full profile on EMR Executive Services
More information on Sanelec Excitation Systems by REIVAX by WEG: See the full profile on EMR Executive Services
More information on Hariharan Sankararaman (Managing Director, Sanelec Excitation Systems, REIVAX, WEG Group): See the full profile on EMR Executive Services
EMR Additional Financial Notes:
- Major financial KPI’s since 2017 are available on EMR Executive Services under “Financial Results” and comparison with peers under “Market Positioning”
- Companies’ full profile on EMR Executive Services are based on their official press releases, quarterly financial reports, annual reports and other official documents like the Universal Registration Document.
- All members of the Executive Committee and of the Board have their full profile on EMR Executive Services
- The WEG 3Q 2026 Earnings Release can be found here: https://api.mziq.com/mzfilemanager/v2/d/50c1bd3e-8ac6-42d9-884f-b9d69f690602/b24337ad-54ab-6c14-441a-a1162a7e8ef9?origin=2
- The WEG 3Q 2026 Financial Statements can be found here: https://api.mziq.com/mzfilemanager/v2/d/50c1bd3e-8ac6-42d9-884f-b9d69f690602/14ddeec3-f628-4137-5047-864d8881b395?origin=2
- The WEG 3Q 2026 Financial Presentation can be found here: Not yet available
- The WEG 2Q 2026 Financial Statements can be found here: https://api.mziq.com/mzfilemanager/v2/d/50c1bd3e-8ac6-42d9-884f-b9d69f690602/5eac6ecc-9d32-e4e2-8c9e-9d1d72bf4643?origin=2
- The WEG 2Q 2026 Financial Presentation can be found here: https://api.mziq.com/mzfilemanager/v2/d/50c1bd3e-8ac6-42d9-884f-b9d69f690602/79a56d91-5241-be06-1cb7-6dacf3f9566d?origin=2
- The WEG 1Q 2026 Financial Statements can be found here: https://api.mziq.com/mzfilemanager/v2/d/50c1bd3e-8ac6-42d9-884f-b9d69f690602/4aa20038-c41f-95e2-eeaa-f892ce566a8f?origin=2
- The WEG 1Q 2026 Financial Presentation can be found here: https://api.mziq.com/mzfilemanager/v2/d/50c1bd3e-8ac6-42d9-884f-b9d69f690602/84855950-3e5e-5143-c04c-5db7a803f615?origin=2
- The WEG Integrated Annual Report 2025 can be found here: https://api.mziq.com/mzfilemanager/v2/d/50c1bd3e-8ac6-42d9-884f-b9d69f690602/9f3d5eb3-6642-3023-2b15-a97f91879b09?origin=2
- The WEG 4Q 2025 Financial Statements can be found here: https://api.mziq.com/mzfilemanager/v2/d/50c1bd3e-8ac6-42d9-884f-b9d69f690602/f320c89e-7e87-ecf9-7335-207fd50bd06a?origin=2
- The WEG 4Q 2025 Financial Presentation can be found here: https://api.mziq.com/mzfilemanager/v2/d/50c1bd3e-8ac6-42d9-884f-b9d69f690602/5c7dd384-4e66-005b-1937-dbefc4b83258?origin=2
- The WEG Day 2025 Investor Presentation (03.10.2025) can be found here: https://api.mziq.com/mzfilemanager/v2/d/50c1bd3e-8ac6-42d9-884f-b9d69f690602/fe942f97-e8ff-a4fc-e2de-c171f799aeac?origin=1
- The WEG Integrated Annual Report 2024 can be found here: https://ri.weg.net/en/financial-information/annual-reports/
- The WEG Financial Statements 2024 can be found here: https://api.mziq.com/mzfilemanager/v2/d/50c1bd3e-8ac6-42d9-884f-b9d69f690602/d55c3099-ff87-5e41-ed29-96cc4f5bf627?origin=1
- The WEG Integrated Annual Report 2023 can be found here: https://api.mziq.com/mzfilemanager/v2/d/50c1bd3e-8ac6-42d9-884f-b9d69f690602/b96ceffc-95bf-5115-8eec-72fbc563ea72?origin=1
- The WEG Investor Presentation 2024 (29.05.2024) can be found here: https://ri.weg.net/en/publications-and-documents/presentations-and-documents/
- The WEG 2022 Integrated Annual Report can be found here: https://api.mziq.com/mzfilemanager/v2/d/50c1bd3e-8ac6-42d9-884f-b9d69f690602/8c163d4c-541a-75bd-eb61-f7f0694d8003?origin=1