Signify – Signify reports first quarter 2026 results with resilient margins and cash flow amid continued market softness


Highlights 1
- Signify’s installed base of connected light points increased to 171 million in Q1 26
- Sales of EUR 1,274 million with a CSG of -5.1% (Q1 25: -2.8%)
- Adj. EBITA margin of 6.5% (Q1 25: 8.0%)
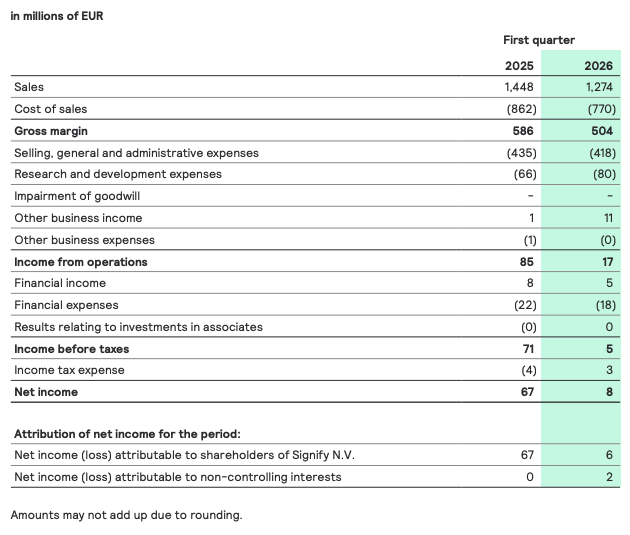
- Net income of EUR 8 million including restructuring costs of EUR 63 million mainly related to the recently announced cost reduction program (Q1 25: EUR 67 million)
- Free cash flow of EUR 47 million (Q1 25: EUR 40 million)
- Signify launched its new Brighter Lives, Better World 2030 program, designed to expand the reach of impactful, energy and resource-efficient lighting to improve lives, save energy, and preserve resources
1 This press release contains certain non-IFRS financial measures and ratios, which are not recognized measures of financial performance or liquidity under IFRS. For further details, refer to “Non-IFRS Financial Measures” in “Important information” of this press release.
Eindhoven, the Netherlands – Signify (Euronext: LIGHT), the world leader in lighting, today announced the company’s first quarter results of 2026.
“In a period of heightened global volatility, we delivered a resilient gross margin and cash flow generation, supported by disciplined cost and price management. Sales were reflective of continued softness in our markets. We are taking actions to outperform the market, while completing our strategic portfolio review to position the company for future success.” said As Tempelman, CEO, Signify.
“We stay close to our customers and suppliers and remain confident in our ability to respond to market risks and opportunities. Based on current market visibility, we confirm our full-year guidance and remain focused on disciplined execution to build momentum through the remainder of 2026.”
Outlook
Signify anticipates the challenging conditions to persist through 2026. Considering the diverging dynamics in its end markets, the company is not providing guidance on full-year sales at this stage. Signify continues to expect an adjusted EBITA margin of 7.5-8.5%, and free cash flow generation of 6.5-7.5% of sales.
Financial review
First quarter
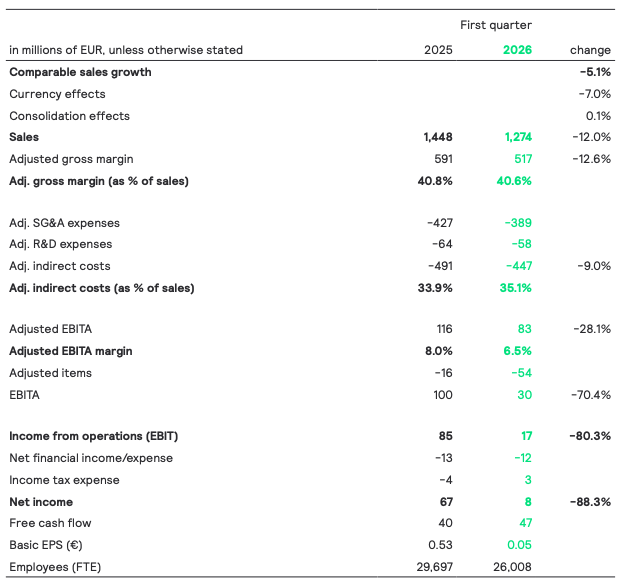
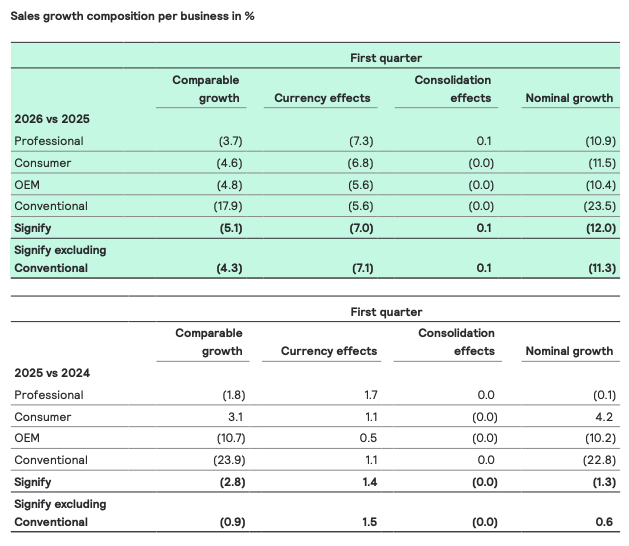
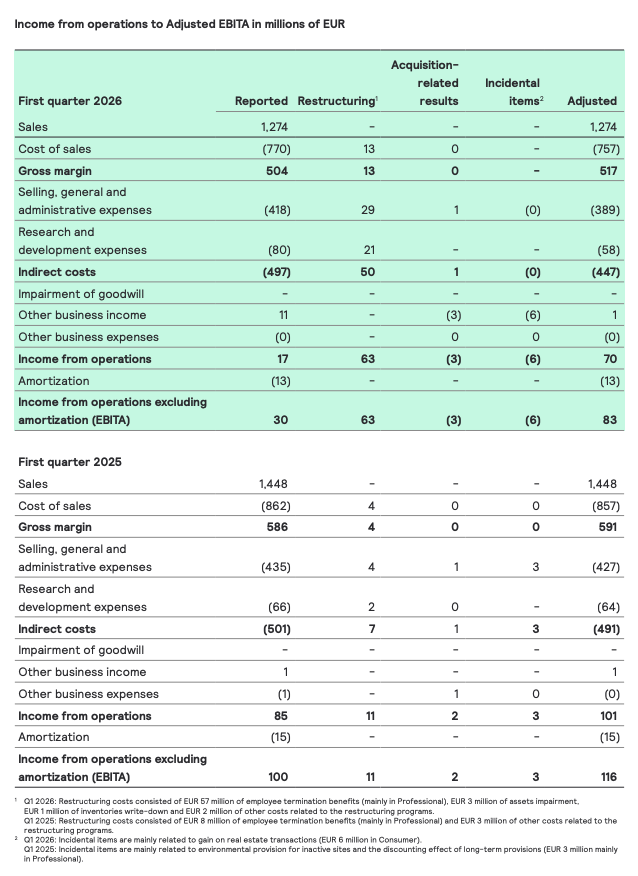
Nominal sales decreased by 12% to EUR 1,274 million, including a negative currency effect of 7.0% primarily related to USD depreciation. Comparable sales declined by 5.1%, reflecting a softer performance in the Professional and Consumer businesses, while the OEM business showed early signs of stabilization.
The Adjusted gross margin decreased by 20 bps to 40.6% but remained at a solid level above 40% and improved sequentially from Q4, driven by disciplined pricing and effective COGS management. Adjusted indirect costs as a percentage of sales increased to 35.1%, as lower volumes led to under-absorption of fixed costs.
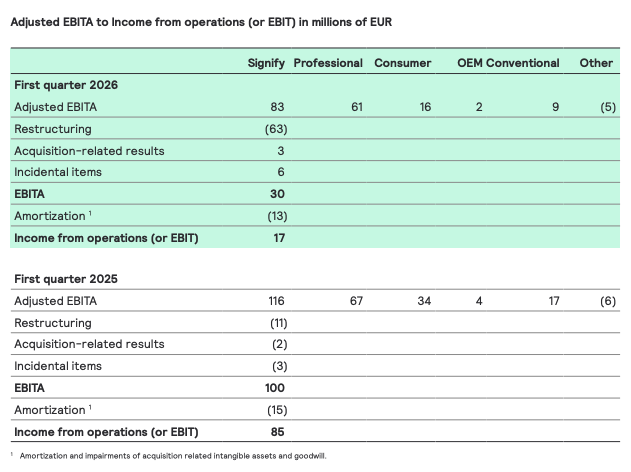
Adjusted EBITA decreased to EUR 83 million. The Adjusted EBITA margin decreased by 150 bps to 6.5%, mainly due to the under-absorption of fixed costs and currency effects, partly offset by cost reductions.
Restructuring costs were EUR 63 million, acquisition-related results were EUR 3 million, and incidental items were EUR 6 million. The restructuring costs booked in Q1 mainly relate to the EUR 180 million cost reduction program announced in January 2026.
Net income decreased to EUR 8 million, driven by higher restructuring costs.
The number of employees (FTE) decreased from 29,697 at the end of Q1 25 to 26,008 at the end of Q1 26. The year-on-year decrease is mostly related to the reduction of factory personnel due to lower production volumes. In general, the number of FTEs is affected by fluctuations in volume and seasonality.
Professional
First quarter
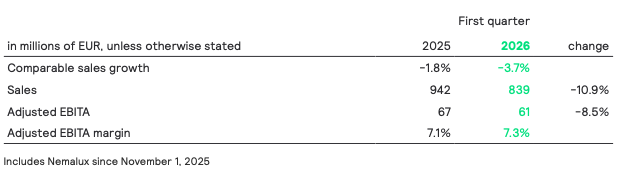
Nominal sales decreased by 10.9% to EUR 839 million, including a negative currency effect of 7.3% primarily related to the depreciation of the USD. Comparable sales declined by 3.7%, driven by continued softness in the trade channel and public projects across Europe and the US, while connected lighting solutions continued to grow. Sequential improvements in Europe driven by indoor project growth. Growth in emerging markets, including China and India, more than offset declines in the Middle East.
The Adjusted EBITA margin increased by 20 bps to 7.3%, supported by gross margin expansion and continued price and cost discipline.
Consumer
First quarter
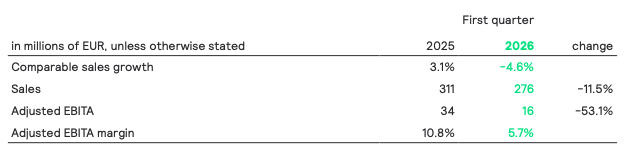
Nominal sales decreased by 11.5% to EUR 276 million, including a negative currency effect of 6.8%, mainly related to the depreciation of the Indian Rupee and US dollar. Comparable sales declined by 4.6%, reflecting retail channel inventory adjustments impacting sell-in, while consumer sell-out remained strong. Performance was further affected by weaker results in Klite, offset by continued growth in India. The Adjusted EBITA margin decreased to 5.7% mainly driven by the negative volume effect.
OEM
First quarter
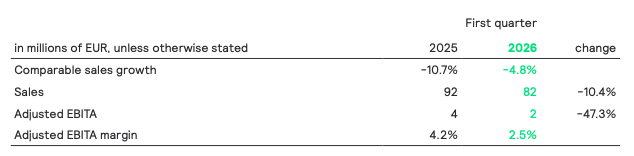
Nominal sales decreased by 10.4% to EUR 82 million, including a negative currency effect of 5.6% mostly related to the depreciation of the US dollar. Comparable sales declined 4.8%, reflecting continued market softness, with pricing pressure beginning to ease and performance showing clear signs of stabilization. The Adjusted EBITA margin decreased to 2.5%, as gross margin was impacted by lower volumes. This was partly offset by cost actions.
Conventional
First quarter
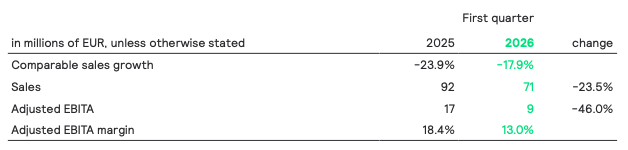
Nominal sales decreased by 23.5% to EUR 71 million, including a negative currency effect of 5.6% mostly related to the depreciation of the US dollar. Comparable sales declined by 17.9% reflecting the structural decline of the business. The Adjusted EBITA margin decreased to 13.0%, reflecting temporarily higher manufacturing costs related to the site rationalization. The business is on track to restore its profitability in the second half of the year as these temporary effects unwind.
Other
First Quarter
‘Other’ reflects the P&L of Signify’s venture businesses, in addition to centrally incurred costs not assigned to individual businesses, predominantly those related to exploratory research initiatives and audit activities. Adjusted EBITA was EUR -5 million (Q1 2025: EUR -6 million).
Working capital
First quarter
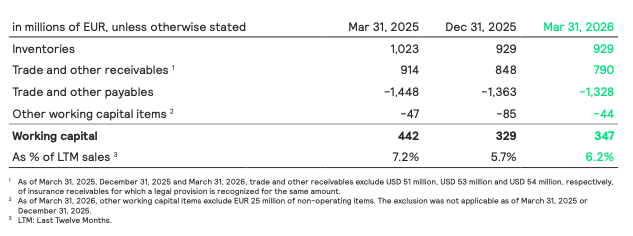
Working capital increased from EUR 329 million at the end of December 2025 to EUR 347 million at the end of March 2026. The increase is driven by a reduction in payables, partly offset by lower receivables. As a percentage of last twelve-months sales, working capital increased by 50 bps to 6.2%.
Compared with March 2025, working capital decreased by EUR 95 million. This decrease is explained by lower receivables and lower inventories, partly offset by lower payables. As a percentage of last twelve-months sales, working capital decreased by 100 bps.
Cash flow analysis
First quarter
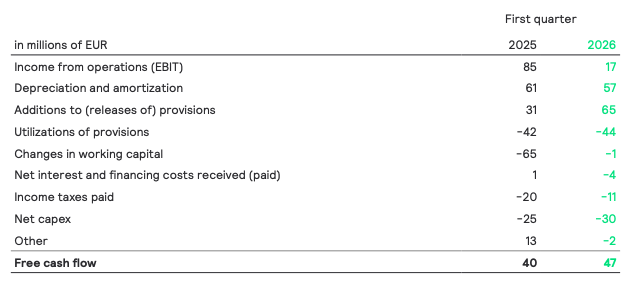
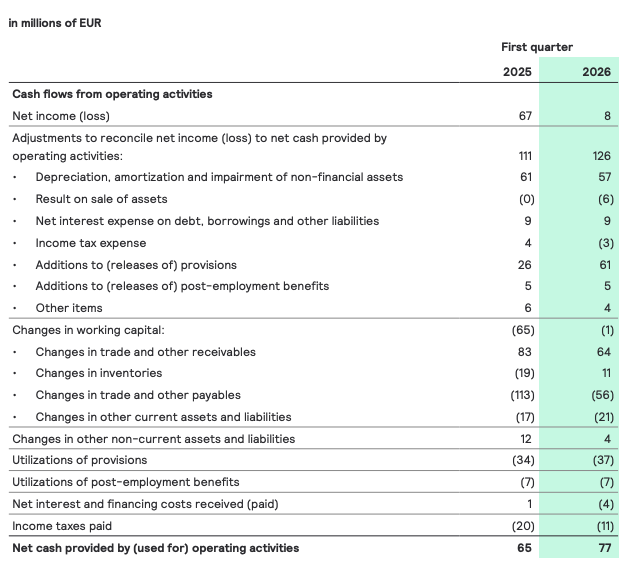
Free cash flow increased to EUR 47 million, primarily due to improved working capital management, partly offset by a lower income from operations. Free cash flow included a restructuring payout of EUR 22 million (Q1 25: EUR 13 million).
Net debt and total equity
First quarter
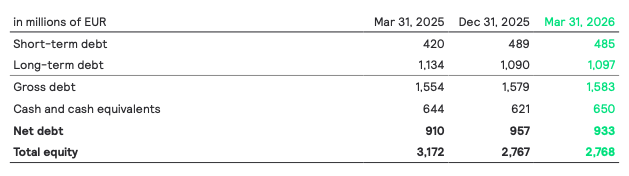
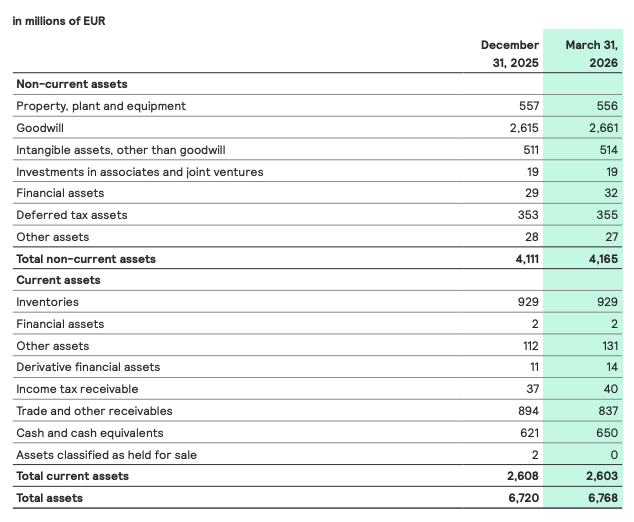
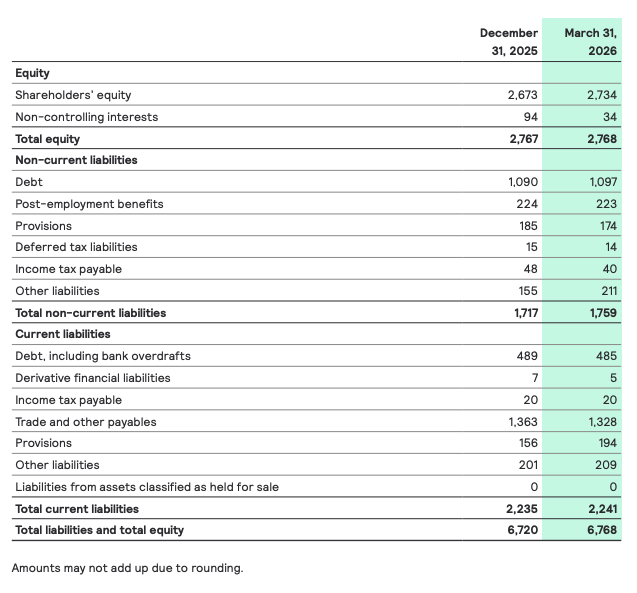
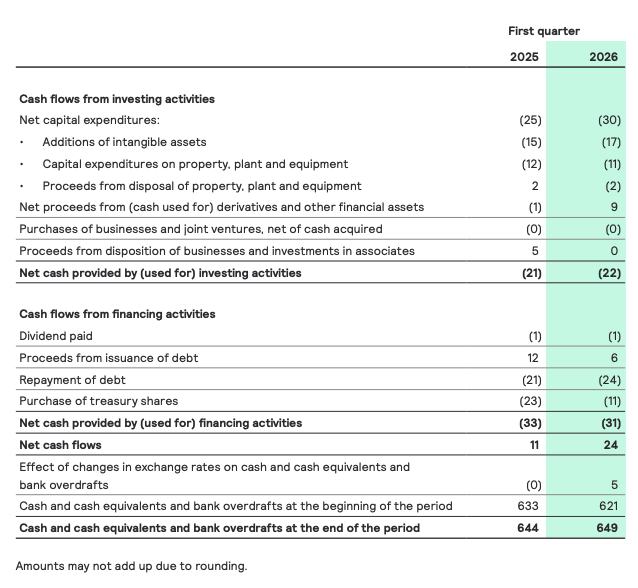
Compared with the end of December 2025, the cash position increased by EUR 29 million to EUR 650 million, while gross debt remained broadly stable at EUR 1,583 million. Net debt decreased by EUR 24 million to EUR 933 million. Total equity remained largely unchanged increasing to EUR 2,768 million (Q4 25: EUR 2,767 million).
Compared with the end of March 2025, the cash position increased by EUR 6 million, primarily due to the free cash flow generation offset by the dividend payment and share buy back program. Gross debt increased by EUR 29 million over the same period. As a result, the net debt increased by EUR 23 million year on year. At the end of March 2026, the net debt/EBITDA ratio was 1.7x (Q1 25: 1.2x).
Brighter Lives, Better World 2030
On March 9th, Signify launched Brighter Lives, Better World 2030, a new program designed to expand the reach of impactful, energy and resource-efficient lighting designed to improve lives, save energy, and preserve resources.
Benefits beyond illumination
Signify aims to expand the role of lighting that improves quality of life: supporting well-being, safety and security in homes, buildings and cities, enabling more efficient food production, and increasing access to solar lighting.
- 2030 ambition: Beyond illumination revenues to reach 41%, rising from 31% in 2024.
Energy efficiency
Through continuous advances in LED and connected lighting, Signify aims to help customers reduce energy use, costs, and resulting emissions.
- 2030 ambition: Deliver a cumulative saving of 60 TWh of energy for customers by 2030.
- 2030 ambition: Achieve a 35% reduction in portfolio CO2 annualized emission intensity.
Resource efficiency and circular value
Signify will scale circular products and services that aim to reduce the consumption of virgin materials and energy while delivering long-term customer value.
- 2030 ambition: Reach 27.5% Signify Circle revenues in Professional Europe.
Progress on Signify’s Brighter Lives, Better World 2030 program will be reported on a quarterly basis, in line with the company’s financial results starting in Q2 2026.
Other information
- Appendix A – Selection of financial statements
- Appendix B – Reconciliation of non-IFRS financial measures
- Appendix C – Financial glossary
Conference call and audio webcast
As Tempelman (CEO) and Željko Kosanović (CFO) will host a conference call for analysts and institutional investors at 9:00 a.m. CET to discuss the first quarter 2026 results. A live audio webcast of the conference call will be available via the Investor Relations website.
Financial calendar 2026
- April 24, 2026 Annual General Meeting of Shareholders
- April 30, 2026 Ex-dividend date
- May 4, 2026 Dividend record date
- May 11, 2026 Dividend payment date
- June 23, 2026 Capital Markets Day
- July 24, 2026 Second quarter results 2026
- October 23, 2026 Third quarter results 2026
Important information
Forward-Looking Statements and Risks & Uncertainties
This document and the related oral presentation contain, and responses to questions following the presentation may contain, forward-looking statements that reflect the intentions, beliefs or current expectations and projections of Signify N.V. (the “Company”, and together with its subsidiaries, the “Group”), including statements regarding strategy, estimates of sales growth and future operational results.
By their nature, these statements involve risks and uncertainties, and there may be many factors that could cause actual results or outcomes to differ materially from those expressed in or implied by these statements. These risks, uncertainties and other factors include macroeconomic volatility, geopolitical and regulatory changes including trade tariffs, competitive price pressure, technological disruptions, reduced governmental funding for energy efficiency and sustainability, currency risks, changes in international tax laws, effects of environmental crises, climate change and natural disasters, cybersecurity risk, and export controls and sanctions.
The above risks may not include all factors that ultimately affect the Group. Additional risks and uncertainties that are currently not known to the Group or not considered material may have a material adverse effect on the business, strategy, results of operations, financial condition and prospects of the Group, or prevent the forward-looking events discussed from occurring. The Group undertakes no duty to and will not necessarily update any of the forward-looking statements in light of new information or future events, except to the extent required by applicable law.
Market and Industry Information
All references to market share, market data, industry statistics and industry forecasts in this document consist of estimates compiled by industry professionals, competitors, organizations or analysts, of publicly available information or of the Group’s own assessment of its sales and markets. Rankings are based on sales unless otherwise stated.
Non-IFRS Financial Measures
Certain parts of this document contain non-IFRS financial measures and ratios, such as comparable sales growth, adjusted gross margin and indirect costs, EBITA, adjusted EBITA, free cash flow, Net debt, Working capital, Brighter lives revenues, Circular revenues and other related ratios, which are not recognized measures of financial performance or liquidity under IFRS. The non-IFRS financial measures presented are measures used by management to monitor the underlying performance of the Group’s business and operations. Not all companies calculate non-IFRS financial measures in the same manner or on a consistent basis and these measures and ratios may not be comparable to measures used by other companies under the same or similar names. A reconciliation of a number of non-IFRS financial measures to the most directly comparable IFRS financial measures is contained in appendix B, Reconciliation of non-IFRS financial measures, of this document. For further information on non-IFRS financial measures, see “Chapter 18 Reconciliation of non-IFRS measures” in the Annual Report 2025.
Presentation
All amounts are in millions of euros unless otherwise stated. Due to rounding, amounts may not add up to totals provided. All reported data is unaudited. Unless otherwise indicated, financial information has been prepared in accordance with the accounting policies as stated in the Annual Report 2025.
Market Abuse Regulation
This press release contains information within the meaning of Article 7(1) of the EU Market Abuse Regulation.
Appendix A – Financial statement information
A. Condensed consolidated statement of income
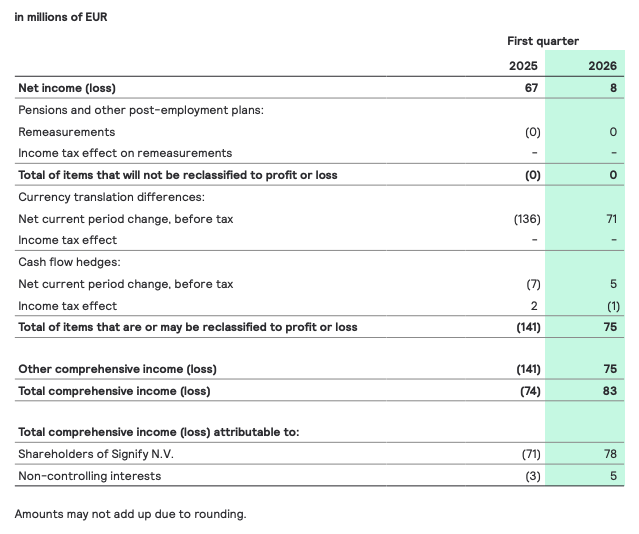
B. Condensed consolidated statement of comprehensive income
C. Condensed consolidated statement of financial position
D. Condensed consolidated statement of cash flows
Appendix B – Reconciliation of non-IFRS financial measures
Appendix C – Financial glossary
- Acquisition-related results Results that are directly triggered by the acquisition of a company, such as transaction costs, purchase accounting related costs, integration-related expenses, and releases of acquisition-related provisions.
- Adjusted EBITA EBITA excluding restructuring costs, acquisitionrelated results, and other incidental items.
- Adjusted EBITA margin Adjusted EBITA divided by sales to third parties (excluding intersegment). ‘Operational profitability’ also refers to this metric.
- Adjusted gross margin Gross margin, excluding restructuring costs, acquisition-related results, and other incidental items attributable to cost of sales.
- Adjusted indirect costs Indirect costs, excluding restructuring costs, acquisition-related results, and other incidental items attributable to indirect costs.
- Adjusted R&D expenses Research and development expenses, excluding restructuring costs, acquisition-related results, and other incidental items attributable to research and development expenses.
- Adjusted SG&A expenses Selling, general and administrative expenses, excluding restructuring costs, acquisition-related results, and other incidental items attributable to selling, general and administrative expenses.
- Comparable sales growth (CSG) The period-on-period growth in sales excluding the effects of currency movements and changes in consolidation.
- Consolidation effects In the event a business is acquired (or divested), the impact of the consolidation (or deconsolidation) on the Group’s figures is included (or excluded) in the calculation of the comparable sales growth figures.
- Currency effects Calculated by translating the foreign currency financials of the previous period and the current period into euros at the same average exchange rates.
- EBIT Income from operations.
- EBITA Income from operations excluding amortization and impairment of acquisition-related intangible assets and goodwill.
- EBITDA Income from operations excluding depreciation, amortization, and impairment of nonfinancial assets.
- Employees Employees of Signify at the end of the period, expressed on a full-time equivalent (FTE) basis.
- Free cash flow Net cash provided by operating activities minus net capital expenditures. Free cash flow includes interest paid and income taxes paid.
- Gross margin Sales minus cost of sales.
- Incidental items Any item with an income statement impact (loss or gain) that is deemed to be both significant and not part of normal business activity. Other incidental items may extend over several quarters within the same financial year.
- Indirect costs The sum of selling, general and administrative expenses and R&D expenses.
- Net capital expenditures Additions of intangible assets, capital expenditures on property, plant and equipment and proceeds from disposal of property, plant and equipment.
- Net debt Short-term debt, long-term debt minus cash and cash equivalents.
- Net leverage ratio The ratio of consolidated reported net debt to consolidated reported EBITDA for the purpose of calculating the financial covenant.
- R&D expenses Research and development expenses.
- Restructuring costs The estimated costs of initiated reorganizations which have been approved by the company and generally involve the realignment of certain parts of the organization. Restructuring costs include costs for employee termination benefits for affected employees and other costs directly attributable to the restructuring, such as impairment of assets and inventories.
- SG&A expenses Selling, general and administrative expenses.
- Working capital The sum of inventories, trade and other receivables (excluding insurance receivables for which a legal provision is recognized for the same amount), other current assets, derivative financial assets minus the sum of trade and other payables, derivative financial liabilities and other current liabilities (excluding dividend-related payables and non-operating liabilities).
SourceSignify
EMR Analysis
More information on Signify: See the full profile on EMR Executive Services
More information on Jeroen Drost (Chairman of the Supervisory Board, Signify): See the full profile on EMR Executive Services
More information on As Tempelman (Member of the Board + Chief Executive Officer, Signify): See the full profile on EMR Executive Services
More information on Željko Kosanović (Member of the Board + Chief Financial Officer + Senior Vice President, Group Controller, Signify): See the full profile on EMR Executive Services
More information on the Sustainability Program (Brighter Lives, Better World 2030) + The Climate Transition Plan 2040 by Signify: See the full profile on EMR Executive Services
More information on Maurice Loosschilder (Head of Sustainability, Signify): See the full profile on EMR Executive Services
More information on Cooper Lighting Solutions by Signify: See the full profile on EMR Executive Services
More information on Kraig Kasler (President, Cooper Lighting Solutions, Signify): See the full profile on EMR Executive Services
More information on Nemalux by Cooper Lighting Solutions by Signify: See the full profile on EMR Executive Services
More information on Samuel Pogosian (Chief Executive Officer, Nemalux, Cooper Lighting Solutions, Signify): See the full profile on EMR Executive Services
EMR Additional Financial Notes:
- Major financial KPI’s since 2017 are available on EMR Executive Services under “Financial Results” and comparison with peers under “Market Positioning”
- Companies’ full profile on EMR Executive Services are based on their official press releases, quarterly financial reports, annual reports and other official documents.
- All members of the Executive Committee and of the Board have their full profile on EMR Executive Services
- The Signify Q1 2026 Results Presentation can be found here: https://www.signify.com/static/quarterlyresults/2026/q1_2026/signify-first-quarter-results-2026-presentation.pdf
- The Signify Annual Report 2025 can be found here: https://www.signify.com/static/2025/signify-annual-report-2025.pdf
- The Signify Q4 2025 Results Report can be found here: https://www.signify.com/static/quarterlyresults/2025/q4_2025/signify-fourth-quarter-and-full-year-results-2025-report.pdf
- The Signify Q4 2025 Results Presentation can be found here: https://www.signify.com/static/quarterlyresults/2025/q4_2025/signify-fourth-quarter-and-full-year-results-2025-presentation.pdf
- The Signify Annual Report 2024 can be found here: https://www.signify.com/static/2024/signify-annual-report-2024.pdf
- The Signify Q4 and Full Year 2024 Results Report can be found here: https://www.signify.com/static/quarterlyresults/2024/q4_2024/signify-fourth-quarter-and-full-year-results-2024-report.pdf
- The Signify Q4 and Full Year 2024 Results Presentation can be found here: https://www.signify.com/static/quarterlyresults/2024/q4_2024/signify-fourth-quarter-and-full-year-results-2024-presentation.pdf
- The Signify comparable financials for 2023 and Q1 2024 following implementation of new organizational structure can be found here: https://www.assets.signify.com/is/content/Signify/Assets/signify/global/news/2024/20240614-signify-publishes-comparable-financials-for-2023-and-q1-2024.pdf
- The Signify Annual Report 2023 can be found here: https://www.signify.com/static/2022/signify-annual-report-2022.pdf
- The Signify Q4 and full-year results 2023 Report can be found here: https://www.signify.com/static/quarterlyresults/2023/q4_2023/signify-fourth-quarter-and-full-year-results-2023-report.pdf
- The Signify Q4 and full-year results 2023 Presentation can be found here: https://www.signify.com/static/quarterlyresults/2023/q4_2023/signify-fourth-quarter-and-full-year-results-2023-presentation.pdf
- The Signify Annual Report 2022 can be found here: https://www.signify.com/static/2022/signify-annual-report-2022.pdf
- The Signify Q4 2022 Presentation can be found here: https://www.signify.com/static/quarterlyresults/2022/q4_2022/signify-fourth-quarter-and-full-year-results-2022-presentation.pdf
- The Signify Business Highlights 2022 Video can be found here: https://www.signify.com/global/our-company/news/press-releases/2023/20230127-signify-fourth-quarter-and-full-year-results-2022