Schneider Electric – Q3 2026 Revenues


Record revenues, strong execution and full year target upgraded
Financial Highlights
- Revenues up +17% organic to €11.5 billion, a record high for any quarter
- Broad-based demand across end-markets, led by Data Center up triple-digit
- Strong growth in Energy Management, up +19% organic
- Continued momentum in Industrial Automation, up +8% organic
- All regions growing, led by China & East Asia up +26% org. and North America up +20% org.
- Accelerating price contributes to Product growth of +17% org.
- Sustainability Impact 2030 program underway, reaching a score of 4.04
- 2026 Financial Target upgraded
Olivier Blum, Chief Executive Officer, commented:
“We delivered record quarterly revenues of €11.5 billion in Q3, growing 17% organically, demonstrating the strength of our value proposition across end-markets and geographies. Energy Management delivered outstanding growth, while Industrial Automation maintained solid momentum. As expected, Data Centers remained a key growth driver as we continue to execute on our backlog while seeing triple-digit demand growth in the quarter, providing increasing visibility into 2027 and 2028. More broadly, demand remained healthy across all four end-markets, supporting another record backlog at quarter-end.
We are seeing strong execution across all our business models. Product growth benefited from both proactive pricing actions and healthy volumes, Systems continued to perform strongly, and Software & Services delivered another solid quarter.
Earlier this month, we announced the signing of a definitive agreement to acquire PTC, a transformative step in advancing our vision of Energy and Industrial Intelligence. Together, we will create a unique Software & AI powerhouse bridging the physical and digital worlds across all our four end markets. By connecting and contextualizing data across the lifecycle of products and assets, we will create a unique digital thread for the next generation of Industrial AI, helping customers to optimize their systems with greater intelligence.
Our Q3 performance demonstrates the relentless focus, agility and execution of our teams across the Group. While pursuing our long-term strategic ambitions, we remain firmly focused on operational excellence and delivering for our customers every day. The strength of our results, backlog and market positions gives us confidence in our ability to capture the opportunities ahead while continuing to execute against our commitments. As a result, we are today upgrading our 2026 financial target.”
I. THIRD QUARTER REVENUES WERE UP +17% ORGANIC
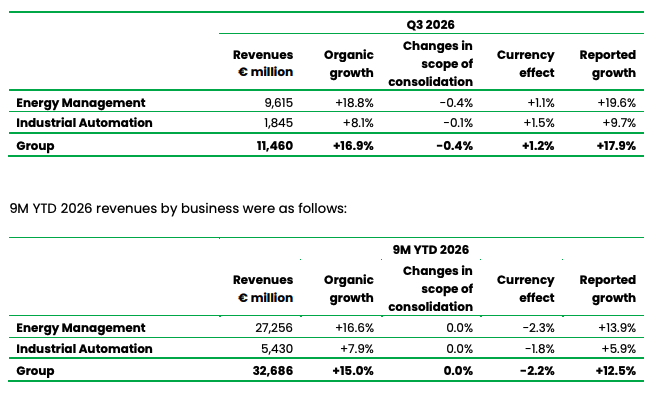
2026 Q3 revenues were €11,460 million, up +16.9% organic and up +17.9% on a reported basis.
Q3 2026 PERFORMANCE BY BUSINESS MODEL
Products (48% of Q3 revenues) grew +17% organic in Q3. Growth was majority volume-driven, with price increasing sequentially as expected, with actions taken at the start of the year now at full runrate and supplementary actions ramping up. Product revenues grew double-digit in Energy Management, with broad-based growth in electrical power distribution across all four end-markets. Products in Industrial Automation also grew double-digit, as the recovery in Discrete automation saw sustained momentum, driving growth across multiple product categories.
Systems (35% of Q3 revenues) grew +22% organic in Q3. Energy Management was up strong double-digit, with Data Center driving growth, notably in prefabricated solutions, continued strength in 3- phase UPS and cooling. The Infrastructure end-market also saw strong growth, notably with Grid customers. Industrial Automation grew low-single digit, seeing good growth with OEMs in Discrete automation, while Process & Hybrid markets saw declines overall, impacted by weakness in China.
Software & Services (17% of Q3 revenues) grew +7% organic in Q3 of which Software & Digital Services (7% of Q3 revenues) grew +8% organic and Field Services (10% of Q3 revenues) grew +7% organic.
- Agnostic Software (comprising AVEVA, ETAP and RIB Software)
- AVEVA delivered strong growth in Annualized Recurring Revenue (ARR), up +10% as of September 30, 2026 led by upsell to existing customers and supported by new logo wins including with customers in Energy & Chemicals (E&C), Transport, Automotive and through distribution channels. Organic revenue growth in Q3 was at similar levels to the ARR growth. Revenue continues to be driven by strong growth in subscription, with cloud-based SaaS continuing to grow significantly faster than on-premise rental. Subscription revenues further advanced as a proportion of total revenues as AVEVA nears completion of its subscription transition.
- Energy Management agnostic software offers (ETAP and RIB Software) grew mid-single digit organic in the quarter, with strong growth in recurring revenues, while perpetual license revenues declined as expected. Performance was differentiated, with ETAP seeing strong organic growth despite a double-digit base of comparison, while organic growth at RIB Software was more subdued, with both impacted by the ongoing subscription transition.
- Services (comprising Digital and Field Services offers) grew high-single digit organic in Q3
- Field Services grew +7% organic in Q3, with high-single digit growth in Energy Management and mid-single digit growth in Industrial Automation. In Energy Management, growth was driven by installation, commissioning and modernization activities in Data Center, supported by strong traction for the Group’s recurring service plan offerings. Sales of the Group’s efficiency and sustainability program offers declined due to demand weakness in previous quarters.
- Digital Services delivered high-single digit organic growth in Q3 driven by EcoStruxure solutions for Data Centers, Cybersecurity, Digital offers for Grid customers and Planon.
Q3 2026 PERFORMANCE BY END-MARKET
Schneider Electric sells its integrated portfolio into four end-markets: Data Center & Networks, Buildings, Industry and Infrastructure, leveraging the unique combination of Energy Management and Industrial Automation complementary offers and technologies supported by the focus on electrification, automation and digitalization to enable a sustainable future.
- Data Center & Networks – The Data Center & Networks end-market delivered another quarter of exceptionally strong demand, with Q3 demand up triple-digit. Demand within the pure Data Center segment remained very strong, up triple-digit globally, with strong demand across all four regions, led by North America, while demand in China & East Asia accelerated to a similar rate. Demand remained broad-based across hyperscale, colocation, neo-cloud and edge customers, reflecting the strength of the Group’s comprehensive portfolio and global footprint. Sales growth in the pure Data Center segment was again up strong double-digit, driven by the Group’s offer in prefabricated solutions, electrical distribution & protection, and cooling. The Distributed IT segment saw strong performance in the quarter, with orders and sales both up double-digit, supported by the strength of the broader end-market.
- Buildings – The Buildings end-market saw strong demand in the quarter, driven mostly by strength in Non-residential while Residential demand remains concentrated in specific countries, most notably in India. Demand in Non-Residential was strong across most geographies, notably in the U.S., which saw strong demand in public access & public administration buildings, and in parts of Europe, while China remained weak. Sales followed a similar trend, with good growth in the Buildings end-market overall, with Non-Residential remaining stronger than Residential in most major geographies apart from India which also saw strength in Residential.
- Industry – Demand in the Industry end-market was strong, with Discrete automation benefiting from sustained strong demand momentum, led by China, India and East Asia. Hybrid automation segments, including Semiconductor and Consumer Packaged Goods also saw strong demand. Demand in Process automation was contrasted by region, with strength in the Middle East and India, both seeing traction in the E&C segment, good demand in North America while China was down and Europe remained subdued. Sales into the Industry end-market saw solid growth overall, including good growth in Discrete automation, and strong contribution from the Semiconductor segment in specific geographies, such as East Asia. Process industries saw positive growth for a second successive quarter, though not yet reflecting the strong demand of past quarters.
- Infrastructure – The Infrastructure end-market saw good demand in the quarter. Demand was strongest in the Water & Wastewater (WWW) segment, primarily in North America, supported by large service and efficiency projects with public utilities. Power & Grid (P&G) demand declined slightly during the period, with sustained strong demand from Grid customers across several geographies offset by declines in Power Generation. There was good demand momentum in the Transportation segment, notably from Marine. The Infrastructure end-market saw good sales growth driven by the Transportation and P&G segments, helped by sales of the Group’s SF6-free switchgear.
Q3 2026 PERFORMANCE BY BUSINESS AND GEOGRAPHY
The breakdown of revenue by business and geography was as follows:
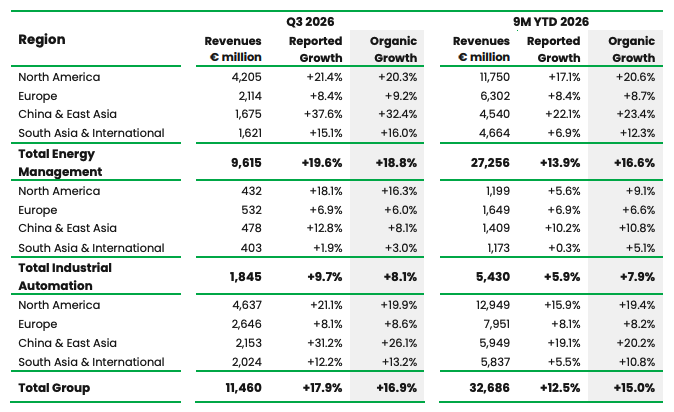
- North America (40% of Q3 revenues) grew +19.9% organic in Q3.
- Energy Management grew +20.3% organic. The U.S. was up strong double-digit, led by strong growth in Data Center, which saw sustained customer demand for the Group’s comprehensive offers, particularly prefabricated solutions and cooling. Growth in other end-markets was solid overall, led by strong growth in Buildings, with continued traction in government-related, public-access and commercial building segments. Industry and Infrastructure were down overall, though growth was contrasted across segments, and included strong growth with Grid customers. Canada grew double-digit led by Data Center and Infrastructure while Buildings remained weak, notably in Residential. Mexico returned to growth, up double-digit against a low base of comparison, led by Buildings and Data Center.
- Industrial Automation grew +16.3% organic. There was strong double-digit growth in industrial software at AVEVA which benefitted from contract renewals in E&C and strong growth through distribution channels. Discrete automation also grew double-digit, accelerating strongly in the quarter, while sales into Process & Hybrid automation declined slightly. The U.S. grew double-digit with strong growth at AVEVA and for Discrete automation offers sold into Industrial Manufacturing, E&C and across the Infrastructure end-market. Mid-single digit growth in Canada was led by Discrete automation, with good traction across many industrial segments, and with good services delivery on a project with an E&C customer. Mexico grew double-digit against a low base of comparison with good contributions from Discrete automation offers in Industrial Manufacturing.
- Europe (23% of Q3 revenues) grew +8.6% organic in Q3.
- Energy Management grew +9.2% organic. Growth was led by the Data Center end-market, notably with regional co-location customers embracing a fully integrated turnkey approach through the Group’s prefabricated solutions. Infrastructure delivered strong growth driven by P&G where utility partnerships and the rollout of SF₆-free solutions supported growth. Buildings delivered good growth overall, led by strength in Non-residential which benefitted from effective commercial actions and continued digital acceleration across distribution channels, while Residential growth was more subdued, and varied by country. Among major economies, growth was led by Germany, up strong double-digit, driven by Data Center and P&G. The U.K. also delivered double-digit growth with strong contribution from Buildings, Industry and Infrastructure. France grew high-single digit led by Data Center, while Italy was up mid-single digit driven by strong momentum in Infrastructure. Spain delivered low-single digit growth against a high base of comparison. Across the rest of the region, growth was high-single digit in aggregate, driven by strong momentum in the Nordics, reflecting ongoing Data Center project execution.
- Industrial Automation grew +6.0% organic. Growth was led by AVEVA, which was up strong double-digit, driven by renewals of several multi-year subscription contracts, both on-premise and SaaS, notably in Germany, Switzerland, U.K. and Norway. Sales into both Discrete and Process & Hybrid automation markets grew low-single digit across the region. By country, the U.K. grew double-digit, driven by strong performance at AVEVA and supported by strong growth in Discrete automation. Germany and Spain each delivered high-single digit growth, with Germany benefitting from strong growth at AVEVA and in Discrete Automation while Spain saw strong growth in Process & Hybrid. France was around flat with growth at AVEVA and in Process & Hybrid automation offset by weakness in Discrete automation. Italy was down slightly against a strong double-digit base of comparison. The rest of Europe grew high-single digit in aggregate, supported by good traction in Discrete automation.
- China & East Asia (19% of Q3 revenues) grew +26.1% organic in Q3.
- Energy Management grew +32.4% organic. China grew strong double-digit with investment in AI infrastructure benefitting several segments. The Data Center segment led growth, both from direct sales to large customers in social media, technology and digital infrastructure and also with domestic and regional co-location customers. The Semiconductor segment drove growth in the Industry end-market, both direct and through OEMs. The Buildings and Infrastructure end-markets were weaker, though the Group has reduced its exposure in Buildings over time, and renewable power generation delivered growth within Infrastructure. East Asia grew strong double-digit, with growth led by Malaysia, Thailand and Indonesia, each benefitting from very strong growth on data center projects, while growth in South Korea and Taiwan was driven by the Semiconductor segment. Elsewhere in East Asia, there was good traction in Industry and Infrastructure projects, compensating for a less dynamic trend in Buildings.
- Industrial Automation grew +8.1% organic, led by double-digit growth in Discrete automation, while sales in Process & Hybrid markets and at AVEVA declined. China was up high single-digit, primarily due to strong performance in Discrete automation markets, with strong growth among export OEMs and an improving trend in the domestic market, tied with AI infrastructure buildout, while sales in Process & Hybrid declined. East Asia grew mid-single digit, with strong growth in Process automation led by Thailand, strong growth in Semiconductor notably in Japan, while AVEVA was down slightly due to timing of renewals.
- South Asia & International (18% of Q3 revenues) grew +13.2% organic in Q3.
- Energy Management grew +16.0% organic. India delivered strong double-digit growth, with broad-based strength across all four end-markets, including particularly strong contributions in Data Center and for backup power and storage for Residential markets. The Middle East & Africa grew double-digit. The Middle East delivered double-digit growth, despite the ongoing geopolitical and macroeconomic tensions in the region, benefitting from strong growth in Data Center, supported by strong momentum with channel partners. Africa was up mid-single digit. Australia grew double-digit, where the Data Center segment continued to be the main driver of growth. South America was down low-single digit, with Chile notably facing a high base of comparison from project execution in Q3’25.
- Industrial Automation grew +3.0% organic. India delivered strong double-digit growth, driven primarily by Discrete automation, and supported by the successful development of core product platforms alongside localized portfolio adaptation. South America delivered double-digit growth, led by AVEVA and supported by strong growth in both Discrete and Process & Hybrid automation, notably through E&C project execution in Brazil. Australia was down double-digit, mainly reflecting a specific contract renewal at AVEVA, while traditional automation markets were around flat. The Middle East & Africa saw a high-single digit decline, where the timing of renewals at AVEVA impacted growth in some Gulf countries, and Egypt faced a high base of comparison from project execution in the prior year.
SCOPE1 AND FOREIGN EXCHANGE2 IMPACTS IN Q3
In Q3, net acquisitions/disposals had an impact of -€36 million or -0.4% of Group revenues, mainly reflecting the impact of some small disposals.
Based on transactions completed to-date, the Scope impact on FY 2026 revenues is estimated to be around -€50 million. The Scope impact on adjusted EBITA margin for FY 2026 is estimated to be around flat.
In Q3, the impact of foreign exchange fluctuations was positive at +€114 million or +1.2% of Group revenues, mostly driven by the strengthening of the Chinese Yuan and the U.S. Dollar against the Euro, partly offset by the weakening of the Indian Rupee against the Euro
Based on current rates3 , the FX impact on FY 2026 revenues is estimated to be between -€300 million to -€400million. The FX impact at current rates on adjusted EBITA margin for FY 2026 could be around flat.
1. Changes in scope of consolidation also include some minor reclassifications of offers among different businesses.
2. For those currencies meeting the criteria to be considered hyperinflationary under IAS 29, such as Argentina and Türkiye, an IFRS technical adjustment for hyperinflation impact is reflected as FX and therefore excluded from the organic growth calculation. The effect of operational actions taken in these countries such as increased pricing to mitigate the inflationary impact is reflected as part of the organic growth.
3. Forward exchange rates are volatile and difficult to predict. Consequently, the impact of such movement and possible impacts from hyperinflation technical accounting (IAS29) are not factored at this stage.
II. SUSTAINABILITY IMPACT 2030
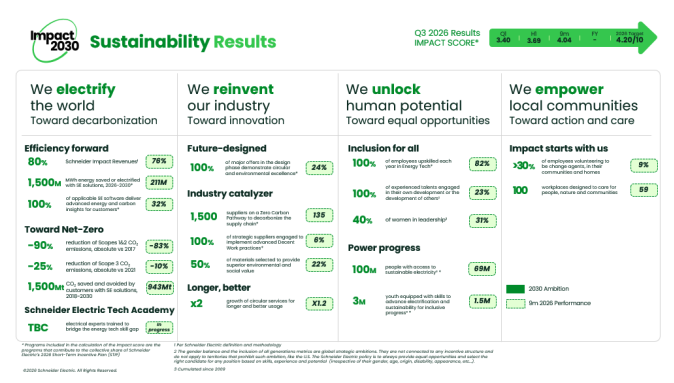
Schneider Electric continued to advance its ambitions across the four strategic pillars of the Group’s sustainability roadmap, combining progress across its own operations with impact delivered through its offers, value chain, people and communities. The Group’s Impact score reached 4.04, on track toward the 2026 target of 4.20/10 (10/10 being the 2030 ambition).
Electrifying the World: Invest in breakthrough solutions and lead the Energy Tech transition by deploying electrification and digitalization, starting with ourselves and scaling for all.
- Schneider Electric continued to decarbonize its operations in Q3, with Scopes 1 and 2 CO₂ emissions reduced by 83% compared to 2017.
- In the first nine months of 2026, Schneider Electric’s solutions enabled customers to save or electrify 211 million MWh.
Reinventing our Industry: Engage and elevate the entire value chain to set new standards in the industry by rethinking how we design, source and promote, and engaging suppliers for decent work and decarbonization.
Schneider Electric accelerated progress across its value chain in the third quarter.
- Building on a decade of supplier decarbonization efforts, Schneider Electric is scaling The Zero Carbon Pathway (TZCP) program, with a ninefold increase in the number of suppliers qualifying under the program, from 15 in the first half of 2026 (H1), to 135 suppliers at the end of Q3. This marks progress toward the Group’s ambition of 1,500 qualifying suppliers by 2030.
- Responsible materials reached 22% across the materials and components covered by the program (steel, aluminium, thermoplastics, electronics, electrical components, and packaging) which assesses key materials against environmental and social criteria, including lower embodied carbon, circularity and responsible supply-chain practices.
Unlocking Human Potential: Open the way to progress and shared prosperity by securing energy access for all and investing in skills and people opportunities.
- Schneider Electric has helped 69 million people gain access to sustainable electricity since 2009 with 1.9 million additional people reached compared to H1 results.
- The Group has also equipped 1.5 million young people with skills to advance electrification and sustainability since 2009, including 90,000 additional people since H1, progressing toward its ambition of 3 million by 2030.
Empowering local communities: Promote local ecosystems and amplify grassroots voices by turning sites into community anchors and empowering our people to be agents of change.
- The Group’s Impact Workplaces initiative accelerated sharply in Q3, growing from 5 sites in the first half of the year to 59 sites at the end of Q3. The program applies a multi-criteria framework spanning climate, resource efficiency, people and communities, as Schneider Electric advances toward its ambition of 100 Impact Workplaces by 2030.
- In line with the Group’s conviction that global sustainability impact must be rooted locally, Schneider Electric is empowering its people to drive impact in the communities where they live and work. By the end of Q3, 9% of employees have engaged as Change Agents, with more than 6,000 additional employees completing a volunteering activity during the quarter and the program expanding from 49 to 57 countries.
“The strong results we are seeing nine months into Impact 2030 reinforce our conviction that advancing Energy Tech can power progress for all. Sustainable progress demands that we bring entire ecosystems along with us and build the capabilities needed to turn new technologies into positive outcomes for people, businesses and communities,” said Esther Finidori, Chief Sustainability Officer at Schneider Electric. “From scaling electrification and supplier decarbonization, to investing in skills and strengthening the role of our people and sites in their local communities, we see momentum across multiple Impact 2030 programs, and we look forward to accelerating these further in the quarters ahead.”
For a detailed view of all indicators and progress, please refer to the full Q3 2026 Schneider Sustainability Impact report, including the latest progress dashboard:
III. PORTFOLIO UPDATES
Acquisitions
- PTC Inc. (“PTC”)
- As separately announced, on October 5, 2026, Schneider Electric and PTC Inc., a leader in complex industrial product design, engineering and data management, announced that they have signed a definitive agreement under which Schneider Electric will acquire PTC. The transaction will create a leading, scaled, open and interoperable industrial software and AI franchise, driving business outcomes for customers from any system of design, control, data and intelligence.
- Subject to completion of the closing conditions, PTC shareholders will receive $205 per share in cash. The transaction values 100% of PTC equity at approximately $22.6 billion, which implies a $23.7 billion enterprise value. Schneider Electric is focused on delivering disciplined shareholder value creation and expects to achieve €250 million of highly executable cost synergies by Year 3 and approximately €800 million of revenue synergies.
- Schneider Electric estimates the transaction would be accretive across key metrics, including revenue growth, recurring revenue mix, gross margin, Adjusted EBITA margin and free cash flow conversion. Schneider Electric expects the transaction to be immediately low single-digit accretive to Adj. EPS (before PPA4 – 4 Purchase Price Accounting impacts as per Schneider Electric definition) in the first year of full consolidation and mid-to high-singledigit accretive to Adj. EPS (before PPA) including full run-rate synergies.
- The transaction has been unanimously approved by the Boards of Directors of both companies. Closing of the transaction is anticipated by Q3 2027, subject to customary closing conditions, including approval by PTC’s shareholders holding at least a majority of outstanding PTC shares at a special shareholder meeting and receipt of required regulatory approvals. The PTC Board of Directors resolved to recommend that the Company’s shareholders approve the Merger Agreement.
- Shelly Group (“Shelly”)
- As separately announced, on September 24, 2026, Schneider Electric reached an agreement with Shelly and its two founding shareholders, for the acquisition by way of a voluntary tender offer for 100% of the shares of Shelly, providing all shareholders with a guaranteed liquidity event and a one-time opportunity to realize immediate and certain value in cash, in an allcash transaction valued at approximately €1.2 bn.
- Shelly is a provider of IoT and smart building solutions and the acquisition would combine Shelly’s software-led home energy platform with Schneider Electric’s technology leadership across residential, retrofit and small commercial buildings.
- Completion of the offer will be subject to Schneider Electric owning more than 95% of the outstanding share capital of Shelly, with a view to proceeding to squeeze out and delist. The transaction is also subject to customary regulatory approvals and is expected to close by Q1 2027.
IV. FINANCING UPDATE
Credit ratings
- Following the announcement on October 5, 2026 of the definitive agreement for the acquisition of PTC, on October 6, 2026 both S&P Global Ratings and Moody’s reaffirmed Schneider Electric’s category-A credit ratings, maintaining A / A-1 (Stable) and A2 (Stable) ratings, respectively.
- The Group remains committed to retaining category-A credit ratings.
V. SHARE BUYBACK
In March 2026, Schneider Electric appointed Natixis to execute a share buyback program with a target amount of €600 million, to be completed by November 2026. Execution is progressing in line with expectations and remains on track for completion by the end of November.
As of September 30, 2026, the Group had purchased 1.6 million shares for €440 million at an average price of €270 per share.
As of October 12, 2026 (the latest practicable date before this release), the Group has purchased 1.8 million shares for €497 million at an average price of €269 per share.
In line with its recent announcement, Schneider Electric remains committed to its share buyback program of €2.5-€3.5 billion through 2030. The Group expects a pause in 2027 and 2028 with acceleration thereafter, before completion of the program by the end of 2030 within the envelope previously announced.
VI. 2026 FISCAL YEAR DIVIDEND CALENDAR
- Dividend ex-date: May 10, 2027
- Record date: May 11, 2027
- Dividend payment date: May 12, 2027
VII. EXPECTED TRENDS FOR Q4
Maintaining strong execution and operational discipline to achieve our upgraded FY26 target in a dynamic environment:
- All four end-markets to drive growth
- Data Center & Networks to sustain strong momentum; Industry and Infrastructure to contribute strongly; Buildings expected to track macroeconomic trends
- Systems to lead growth; strong Products growth supported by continued pricing momentum
- Sustained momentum in recurring Software revenues; accelerating growth in Services
- All four regions to deliver topline increase, led by U.S., China and India
- Disruption in the Middle East may impact Q4, with potential for pressure on global supply chains and increased inflation
- Disciplined execution of Company program
- Continued pricing momentum expected to offset the value impact of raw material inflation and net tariffs in FY26
- Productivity and operating leverage to contribute positively to adj. EBITA margin.
VIII. 2026 TARGET UPGRADED
The Group upgrades its 2026 financial target as follows:
2026 Adjusted EBITA growth of between +18% and +21% organic.
The target would be achieved through a combination of organic revenue growth and margin improvement, currently expected to be:
- Revenue growth of +12% to +14% organic
- Adjusted EBITA margin up +100bps to +120bps organic
This implies Adjusted EBITA margin of around 19.7% to 19.9% (including scope based on transactions completed to-date and FX based on current estimation).
Further notes on 2026 available in appendix
The Q3 2026 revenues presentation is available at www.se.com
The 2026 Full Year Results will be presented on February 18, 2027
Disclaimer: All forward-looking statements are Schneider Electric management’s present expectations of future events and are subject to a number of factors and uncertainties that could cause actual results to differ materially from those described in the forward-looking statements. For a detailed description of these factors and uncertainties, please refer to the section “Risk Factors” in our Universal Registration Document (which is available on www.se.com). Schneider Electric undertakes no obligation to publicly update or revise any of these forward-looking statements.
Appendix – Further notes on 2026
- Foreign Exchange impact: Based on current rates5 , the FX impact on FY 2026 revenues is estimated to be between -€300 million to -€400 million. The FX impact at current rates on adjusted EBITA margin for FY 2026 could be around flat
- Scope impact: Around -€50 million on 2026 revenues and around flat on 2026 adjusted EBITA margin, based on transactions completed to-date
- Tax rate: The ETR is expected to be in a 23-25% range in 2026
- Restructuring: The Group expects restructuring costs in FY26 to reach around €450 million in total.
5. Forward exchange rates are volatile and difficult to predict. Consequently, the impact of such movement and possible impacts from hyperinflation technical accounting (IAS29) are not factored at this stage.
Appendix – Revenues breakdown by business
Q3 2026 revenues by business were as follows:
Throughout this document growth percentage calculations are compared to the same period of the prior year, unless stated otherwise.
Appendix – Scope of Consolidation
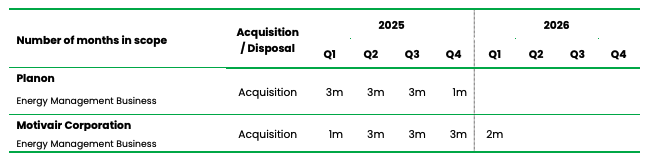
SourceSchneider Electric
EMR Analysis
More information on Schneider Electric: See the full profile on EMR Executive Services
More information on Jean-Pascal Tricoire (Chairman of the Board of Directors, Member of the Governance, Nominations & Sustainability Committee, Member of the Investment Committee, Member of the Digital Committee, Schneider Electric): See the full profile on EMR Executive Services
More information on Olivier Blum (Chief Executive Officer, Schneider Electric): See the full profile on EMR Executive Services
More information on Nathan Fast (Member of the Executive Committee and Executive Vice President, Group Chief Financial Officer, Schneider Electric): See the full profile on EMR Executive Services
More information on Antoine Sage (Senior Vice President, Head of Investor Relations, Schneider Electric): See the full profile on EMR Executive Services
More information on Energy Management by Schneider Electric: See the full profile on EMR Executive Services
More information on Frédéric Godémél (Member of the Executive Committee and Executive Vice President, Energy Management, Schneider Electric): See the full profile on EMR Executive Services
More information on Industrial Automation by Schneider Electric: See the full profile on EMR Executive Services
More information on Gwenaelle Avice-Huet (Member of the Executive Committee and Executive Vice President, Industrial Automation, Schneider Electric): See the full profile on EMR Executive Services
More information on the Schneider Electric Sustainability Strategy, Sustainability Impact 2030 Roadmap and 2025 Sustainability Report: See the full profile on EMR Executive Services
More information on Esther Finidori (Member of the Executive Committee and Chief Sustainability Officer, Schneider Electric): See the full profile on EMR Executive Services
More information on AVEVA by Schneider Electric: See the full profile on EMR Executive Services
More information on Caspar Herzberg (Member of the Executive Committee, Chief Executive Officer, AVEVA, Schneider Electric): See the full profile on EMR Executive Services
More information on Operation Technology Inc. (“ETAP”) by Schneider Electric: See the full profile on EMR Executive Services
More information on Tanuj Khandelwal (Chief Executive Officer, ETAP, Schneider Electric): See the full profile on EMR Executive Services
More information on RIB Software by Schneider Electric: See the full profile on EMR Executive Services
More information on René Wolf (Chief Executive Officer, RIB Software, Schneider Electric): See the full profile on EMR Executive Services
More information on EcoStruxure™ by Schneider Electric: https://www.se.com/ww/en/work/campaign/innovation/overview.jsp + EcoStruxure is Schneider Electric’s IoT-enabled, plug-and-play, open, interoperable architecture and platform, in Homes, Buildings, Data Centers, Infrastructure and Industries. Innovation at Every Level from Connected Products to Edge Control, and Apps, Analytics and Services.
- 45,000 + Developers and system integrators
- 650,000+ Service providers and partners
- 480,000 Sites deployed
More information on Planon by Schneider Electric: See the full profile on EMR Executive Services
More information on Motivair Corporation by Schneider Electric: See the full profile on EMR Executive Services
More information on Rich Whitmore (President & Chief Executive Officer, Motivair Corporation, Schneider Electric): See the full profile on EMR Executive Services
More information on PTC: https://www.ptc.com/en + PTC (NASDAQ: PTC) is a global software company enables manufacturers and product companies to digitally transform how they design, manufacture, and service the physical products that the world relies on. Headquartered in Boston, Massachusetts, PTC employs over 7,000 people and supports more than 30,000 customers globally.
PTC, PTC Next, Creo, Onshape, Windchill, Arena, Codebeamer, ServiceMax, Servigistics, PTC Orbit, PTC Jetstream, Pure Variants, and the PTC logo are trademarks or registered trademarks of PTC Inc. and its subsidiaries in the United States and other countries.
Our purpose statement is the Power To Create.
More information on Neil Barua (President and Chief Executive Officer, PTC): https://www.ptc.com/en/about/executive-team + https://www.linkedin.com/in/neilbarua/
More information on Shelly Group SE: https://corporate.shelly.com/en + Shelly Group transforms innovative ideas and technologies into high-quality IoT solutions for enhanced product efficiency and reliability.
Shelly’s mission is to nurture customers make eco-conscious choices in their daily lives and business practices, using data-powered tools to track and manage energy consumption. Shelly’s vision is to become the preferred partner that offers long-lasting smart solutions to bring sustainable living closer to everyone.
Shelly Group consists of 6 subsidiary companies and has offices in Bulgaria, Germany, Slovenia, China and USA. The company has already conquered over 100 markets, helping customers lead a calmer and happier life while increasing the energy efficiency and comfort of every home or business building.
More information on Dimitar Dimitrov (Co-founding Shareholder and Co-Chief Executive Officer, Shelly Group): https://corporate.shelly.com/en/executive-team + https://www.linkedin.com/in/allterco/
More information on Svetlin Todorov (Co-founding Shareholder and US Operations Chief Executive Officer, Shelly Group): https://corporate.shelly.com/en/executive-team + https://www.linkedin.com/in/svetlin-todorov/
More information on Wolfgang Kirsch (Co-Chief Executive Officer, Shelly Group): https://corporate.shelly.com/en/executive-team + https://www.linkedin.com/in/wolfgang-kirsch/
More information on S&P Global: https://www.spglobal.com/en/ + S&P Dow Jones Indices is the largest global resource for essential index-based concepts, data and research, and home to iconic financial market indicators, such as the S&P 500® and the Dow Jones Industrial Average®. More assets are invested in products based on our indices than products based on indices from any other provider in the world. Since Charles Dow invented the first index in 1884, S&P DJI has been innovating and developing indices across the spectrum of asset classes helping to define the way investors measure and trade the markets.
S&P Dow Jones Indices is a division of S&P Global (NYSE: SPGI), which provides essential intelligence for individuals, companies, and governments to make decisions with confidence.
More information on Douglas L. Peterson (President and Chief Executive Officer, S&P Global): https://www.spglobal.com/en/who-we-are/our-people/operating-committee/douglas-peterson + https://www.linkedin.com/in/douglas-peterson-1254245/
More information on S&P Global Ratings: https://www.spglobal.com/ratings/en/ +We accelerate progress through our essential intelligence, providing data & analytics, research & commentary, credit ratings, benchmarks and ESG solutions.
Credit ratings are forward looking opinions about an issuer’s relative creditworthiness. They provide a common and transparent global language for investors to form a view on and compare the relative likelihood of whether an issuer may repay its debts on time and in full. Credit Ratings are just one of many inputs that investors and other market participants can consider as part of their decision-making processes.
Our Ratings Scale
- AAA
- Investment Grade:Extremely strong capacity to meet financial commitments
- AA
- Investment Grade:Very strong capacity to meet financial commitments
- A
- Investment Grade:Strong capacity to meet financial commitments, but somewhat susceptible to economic conditions and changes in circumstances
- BBB
- Investment Grade:Adequate capacity to meet financial commitments, but more subject to adverse economic conditions
- BB
- Speculative Grade :Less vulnerable in the near-term but faces major ongoing uncertainties to adverse business, financial and economic conditions
- B
- Speculative Grade :More vulnerable to adverse business, financial and economic conditions but currently has the capacity to meet financial commitments
- CCC
- Speculative Grade :Currently vulnerable and dependent on favorable business, financial and economic conditions to meet financial commitments
- CC
- Speculative Grade :Highly vulnerable; default has not yet occurred, but is expected to be a virtual certainty
- C
- Speculative Grade :Currently highly vulnerable to non-payment, and ultimate recovery is expected to be lower than that of higher rated obligations
- D
- Speculative Grade :Payment default on a financial commitment or breach of an imputed promise; also used when a bankruptcy petition has been filed
More information on Moody’s Corporation: https://www.moodys.com/ + Moody’s delivers credit ratings, research, and a wide suite of data, analytics, and workflow solutions that help organizations understand risk and act with confidence. Agentic AI capabilities are embedded into our data ecosystem, deploying intelligent agents designed to uncover insights faster for smarter, more informed decisions.
We are a global integrated risk assessment firm that empowers organizations to make better decisions. Our data, analytical solutions and insights help decision-makers identify opportunities and manage the risks of doing business with others. We believe that greater transparency, more informed decisions, and fair access to information open the door to shared progress. With over 13,000 employees in more than 40 countries, Moody’s combines global presence with local expertise and over a century of experience in financial markets.
Moody’s Corporation is comprised of separate divisions. Moody’s Ratings publishes credit ratings and provides assessment services on a wide range of debt obligations, programs and facilities, and the entities that issue such obligations in markets worldwide, including various corporate, financial institution and governmental obligations, and structured finance securities.
More information on Robert Fauber (President and Chief Executive Officer, Moody’s Corporation): https://www.moodys.com/web/en/us/about-us.html + https://www.linkedin.com/in/robfaubermoodys/
More information on Moody’s Rating by Moody’s Corporation: https://ratings.moodys.io/ + Moody’s Ratings is a leading global provider of credit ratings, research, and risk analysis. Moody’s Ratings may enable issuers to create timely, go-to-market debt strategies with the ability to capture wider investor focus and provides investors with a comprehensive view of global debt markets through our credit ratings and research. Moody’s Ratings trusted insights can help decision-makers navigate through turmoil and market volatility.
Ratings assigned on Moody’s Ratings global long-term and short-term rating scales are forward-looking opinions of the relative credit risks of financial obligations issued by non-financial corporates, financial institutions, structured finance vehicles, project finance vehicles, and public sector entities. The following is a ranking (from highest to lowest) of Moody’s Ratings long-term and short-term categories.
Long-term ratings are assigned to issuers or obligations with an original maturity of eleven months or more and reflect both on the likelihood of a default or impairment on contractual financial obligations and the expected financial loss suffered in the event of default or impairment.
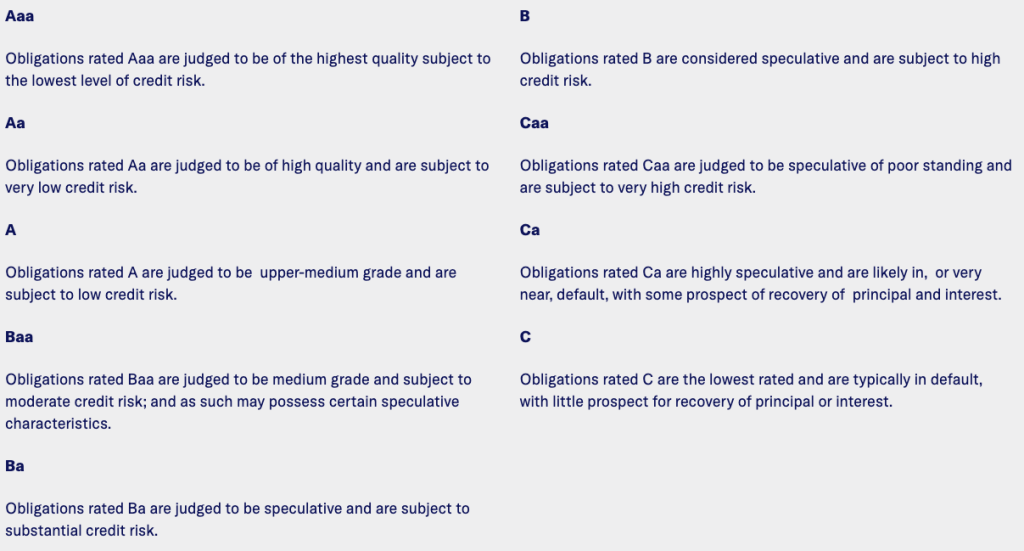
Note: Moody’s Ratings appends numerical modifiers 1, 2, and 3 to each generic rating classification from Aa through Caa. The modifier 1 indicates that the obligation ranks in the higher end of its generic rating category; the modifier 2 indicates a midrange ranking; and the modifier 3 indicates a ranking in the lower end of that generic rating category.
More information on Natixis by BPCE Group: https://natixis.groupebpce.com/ + Our experts offer innovative and sustainable financing and investment solutions to support corporations, investors, financial institutions, financial sponsors and customers of the Groupe BPCE retail banking networks in the implementation of today’s environmental, technological and societal transitions.
Natixis Corporate & Investment Banking is a leading global financial institution that provides advisory, investment banking, financing, corporate banking and capital markets services to corporations, financial institutions, financial sponsors and sovereign and supranational organizations worldwide.
Our teams of experts in around 30 countries advise clients on their strategic development, helping them to grow and transform their businesses, and maximize their positive impact. Natixis CIB is committed to aligning its financing portfolio with a carbon neutrality path by 2050 while helping its clients reduce the environmental impact of their business.
As part of Groupe BPCE, the second largest banking group in France through the Banque Populaire and Caisse d’Epargne retail networks, Natixis CIB benefits from the Group’s financial strength and solid financial ratings (Standard & Poor’s: A, Moody’s: A1, Fitch Ratings: A+, R&I: A+).
More information on Mohamed Kallala (Chief Executive Officer, Natixis, BPCE Group): https://natixis.groupebpce.com/about-us/governance/ + https://www.linkedin.com/in/mohamed-kallala-b221b782/
EMR Additional Financial Notes:
- Major financial KPI’s since 2017 are available on EMR Executive Services under “Financial Results” and comparison with peers under “Market Positioning”
- Companies’ full profile on EMR Executive Services are based on their official press releases, quarterly financial reports, annual reports and other official documents like the Universal Registration Document.
- All members of the Executive Committee and of the Board have their full profile on EMR Executive Services
- The Schneider Electric Third Quarter 2026 Results Earning Release can be found here: https://www.se.com/ww/en/assets/pdf/release-Q3-revenues-2026
- The Schneider Electric Third Quarter 2026 Results Presentation can be found here: https://www.se.com/ww/en/assets/pdf/presentation-Q3-revenues-2026
- The Schneider Electric Third Quarter 2026 Results Accounts can be found here: Not yet available
- The Schneider Electric Second Quarter 2026 Results Earning Release can be found here: https://www.se.com/ww/en/assets/pdf/release-hy-results-2026
- The Schneider Electric Second Quarter 2026 Results Presentation can be found here: https://download.se.com/files?p_Doc_Ref=presentation-hy-results-2026
- The Schneider Electric Second Quarter 2026 Results Accounts can be found here: https://www.se.com/ww/en/assets/pdf/accounts-hy-results-2026
- The Schneider Electric First Quarter 2026 Results Presentation can be found here: https://www.se.com/ww/en/assets/pdf/presentation-q1-revenues-2026
- The Schneider Electric 2025 Universal Registration Document can be found here: https://download.schneider-electric.com/files?p_Doc_Ref=2025-URD
- The Schneider Electric Full Year 2025 Results Presentation can be found here: https://cdn.builder.io/o/assets%2F87a13b564d504489a60e78515594f31e%2F7b1392bb0421417abd4c8b6a96f0e6d0?alt=media&token=7d64e2f4-1ad8-4b92-b960-8093644b4f7b&apiKey=87a13b564d504489a60e78515594f31e
- The Schneider 2023-2025 Financial Information Presentation can be found here: https://cdn.builder.io/o/assets%2F87a13b564d504489a60e78515594f31e%2Fa43818ab3d634a9099cc0e1f76a0fa0e?alt=media&token=16c2ae5e-e6da-4960-852c-0247b8c7db7c&apiKey=87a13b564d504489a60e78515594f31e
- The Schneider Electric Full Year 2025 Consolidated Financial Statements can be found here: https://cdn.builder.io/o/assets%2F87a13b564d504489a60e78515594f31e%2F944edc3a70cf48928d925433c41c8109?alt=media&token=29980528-77b4-43d6-9a46-d69f8609e864&apiKey=87a13b564d504489a60e78515594f31e
- The Schneider Electric 2024 Universal Registration Document can be found here: https://www.se.com/ww/en/assets/564/document/510443/2024-universal-registration-document.pdf
- The Schneider Electric Full Year 2024 Results Presentation can be found here: https://www.se.com/ww/en/assets/564/document/505718/presentation-fy-results-2024.pdf
- The Schneider Electric Full Year 2024 Financial Report can be found here: https://www.se.com/ww/en/assets/564/document/505720/accounts-fy-results-2024.pdf
- The Schneider Electric 2023 Universal Registration Document can be found here: https://www.se.com/ww/en/assets/564/document/462018/2023-universal-registration-document.pdf
- The Schneider Electric Full Year 2023 Results Presentation can be found here: https://www.se.com/ww/en/assets/564/document/453166/presentation-fy-results-2023.pdf
- The Schneider Electric Full Year 2023 Annual Financial Report can be found here: https://www.se.com/ww/en/assets/564/document/453167/accounts-fy-results-2023.pdf
- The Schneider Electric 2022 Universal Registration Document can be found here: https://flipbook.se.com/catalog/ww/en/41123-Schneider-Annual-Report-2022-EN/#page/1