Rockwell Automation – Rockwell Automation reports second quarter 2026 results


- Reported sales up 12% year over year; organic sales up 9% year over year
- Diluted EPS of $3.10 and Adjusted EPS of $3.30; up 40% and 32% year over year, respectively
- Total ARR up 6% year over year
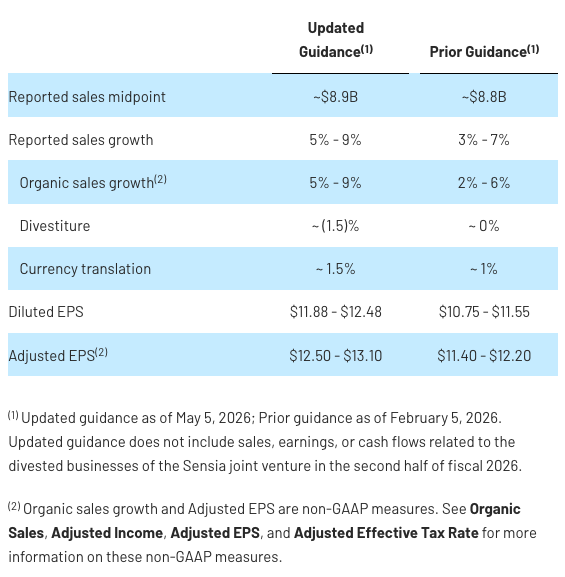
- Updates fiscal 2026 reported sales growth and organic sales growth ranges to 5% – 9%
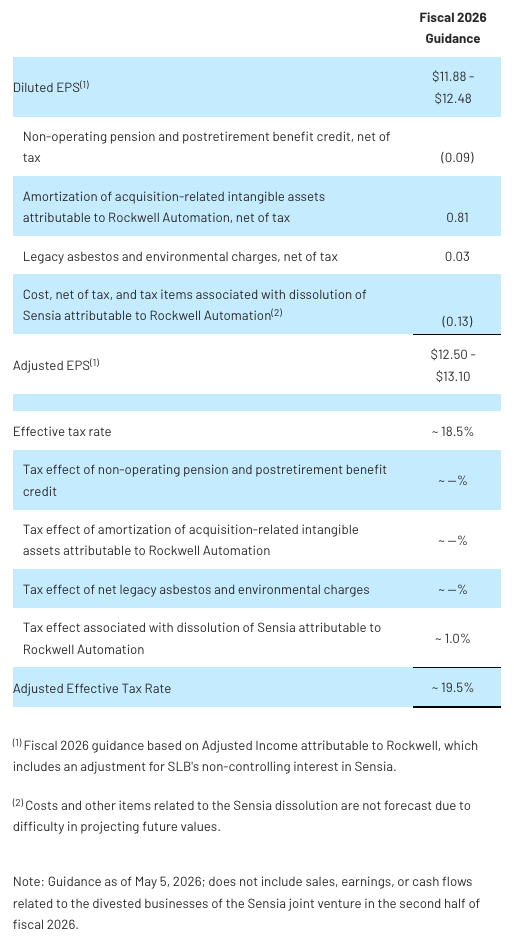
- Updates fiscal 2026 diluted EPS guidance range to $11.88 – $12.48 and Adjusted EPS guidance range to $12.50 – $13.10
- Introduces Enterprise operating profit and Enterprise operating margin performance measures, which include Corporate and other expenses
MILWAUKEE–(BUSINESS WIRE)– Rockwell Automation, Inc. (NYSE: ROK) today reported second quarter fiscal 2026 results.
“We delivered a strong second quarter, with double-digit growth in sales and earnings exceeding our expectations. We saw solid momentum across much of the business, led by improving demand in warehouse automation, data center, semiconductor, and energy. Our performance this quarter reflects the strength of our portfolio and the team’s ability to execute in a dynamic global environment,” said Blake Moret, Chairman and CEO.
Fiscal Q2 2026 Financial Results
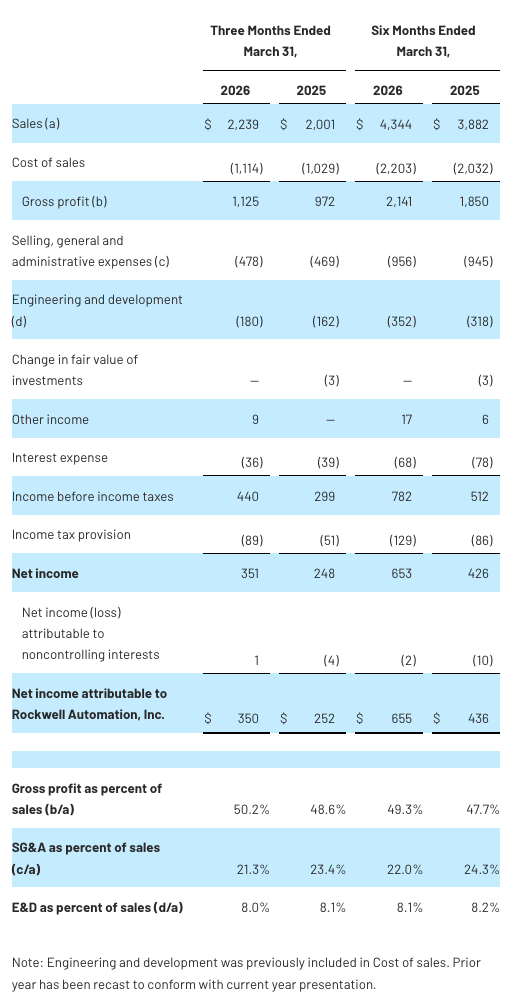
Fiscal 2026 second quarter sales were $2,239 million, up 12% from $2,001 million in the second quarter of fiscal 2025. Organic sales increased 9% and currency translation increased sales by 3%.
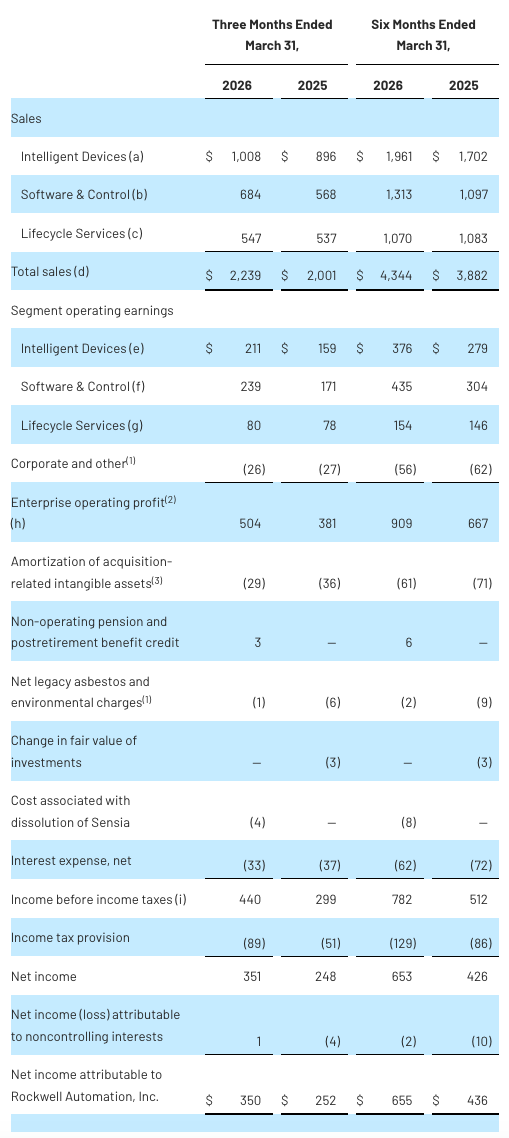
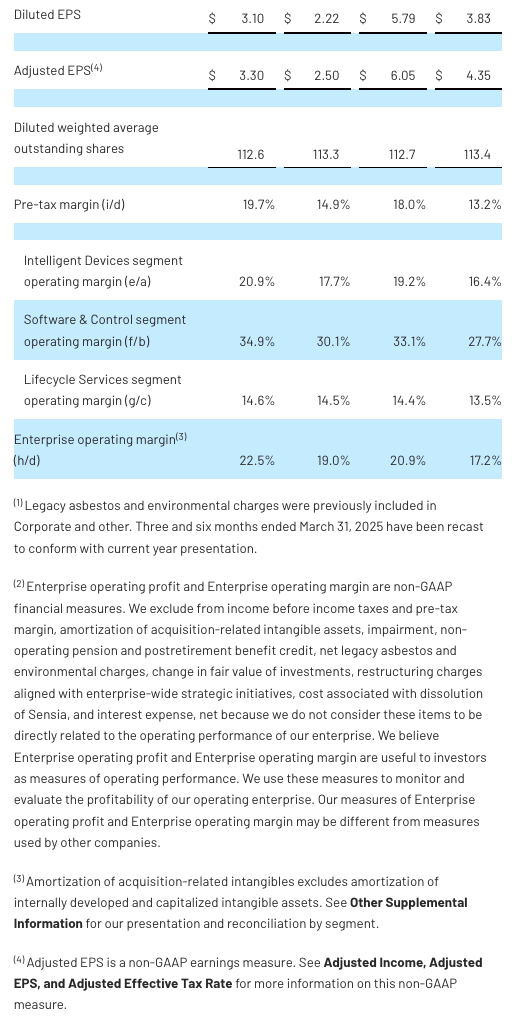
Income before income taxes was $440 million in the second quarter of fiscal 2026 compared to $299 million in the same period last year. Pre-tax margin was 19.7% in the second quarter of fiscal 2026 compared to 14.9% in the same period last year. Enterprise operating profit was $504 million in the second quarter of fiscal 2026, up 32% from $381 million in the same period of fiscal 2025. Enterprise operating margin was 22.5% compared to 19.0% a year ago. The increases in pre-tax margin and Enterprise operating margin were primarily due to higher sales volume, positive price/cost inclusive of productivity, and favorable mix, partially offset by higher compensation.
Fiscal 2026 second quarter Net income attributable to Rockwell Automation was $350 million or $3.10 per share, compared to $252 million or $2.22 per share in the second quarter of fiscal 2025. The increases in Net income attributable to Rockwell Automation and diluted EPS were primarily due to higher pre-tax margin. Fiscal 2026 second quarter Adjusted EPS was $3.30, up 32% compared to $2.50 in the second quarter of fiscal 2025 primarily due to higher Enterprise operating margin.
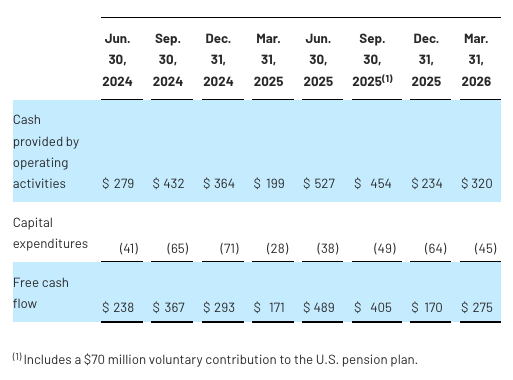
Cash provided by operating activities in the second quarter of fiscal 2026 was $320 million, compared to $199 million in the second quarter of fiscal 2025. Free cash flow in the second quarter of fiscal 2026 was $275 million, compared to $171 million in the same period last year. Increases in cash provided by operating activities and free cash flow were primarily due to higher pre-tax income.
Fiscal Year 2026 Outlook
The table below provides updated fiscal 2026 guidance. Following the April 1, 2026 dissolution of the Sensia joint venture, the sales, earnings, and cash flows of the divested businesses are excluded from second-half guidance. Organic sales growth for the third and fourth quarters will reflect adjustments for comparable prior-year periods.
“We see improvement in several additional end markets, although capital investment remains muted in other key verticals. We are focused on execution of our growth and performance objectives, with differentiated technology, expanded coverage of customers in high-growth end markets, and disciplined capital allocation. These actions position us to deliver near-term results while accelerating the creation of long-term value,” Moret continued.
Following is a discussion of second quarter results for our business segments.
Intelligent Devices
Intelligent Devices second quarter fiscal 2026 sales were $1.0 billion, an increase of 13% compared to $896 million in the same period last year. Organic sales increased 9% and currency translation increased sales by 4%. Segment operating earnings were $211 million compared to $159 million in the same period last year. Segment operating margin increased to 20.9% from 17.7% a year ago. The increase in segment operating margin from prior year was driven by positive price/cost inclusive of productivity, higher sales volume, and favorable mix, partially offset by higher compensation.
Software & Control
Software & Control second quarter fiscal 2026 sales were $684 million, an increase of 20% compared to $568 million in the same period last year. Organic sales increased 17% and currency translation increased sales by 3%. Segment operating earnings were $239 million compared to $171 million in the same period last year. Segment operating margin increased to 34.9% from 30.1% a year ago driven by higher sales volume and positive price/cost inclusive of productivity, partially offset by higher compensation.
Lifecycle Services
Lifecycle Services second quarter fiscal 2026 sales were $547 million, an increase of 2% compared to $537 million in the same period last year. Organic sales decreased (1)% and currency translation increased sales by 3%. Segment operating earnings were $80 million compared to $78 million in the same period last year. Segment operating margin was 14.6% compared to 14.5% a year ago.
Supplemental Information
ARR – Total ARR grew 6% compared to the end of the second quarter of fiscal 2025.
Corporate and other – Fiscal 2026 second quarter Corporate and other expense was $26 million compared to $27 million in the second quarter of fiscal 2025.
Amortization of acquisition-related intangible assets – Fiscal 2026 second quarter Amortization of acquisition-related intangible assets expense was $29 million, compared to $36 million the second quarter of fiscal 2025.
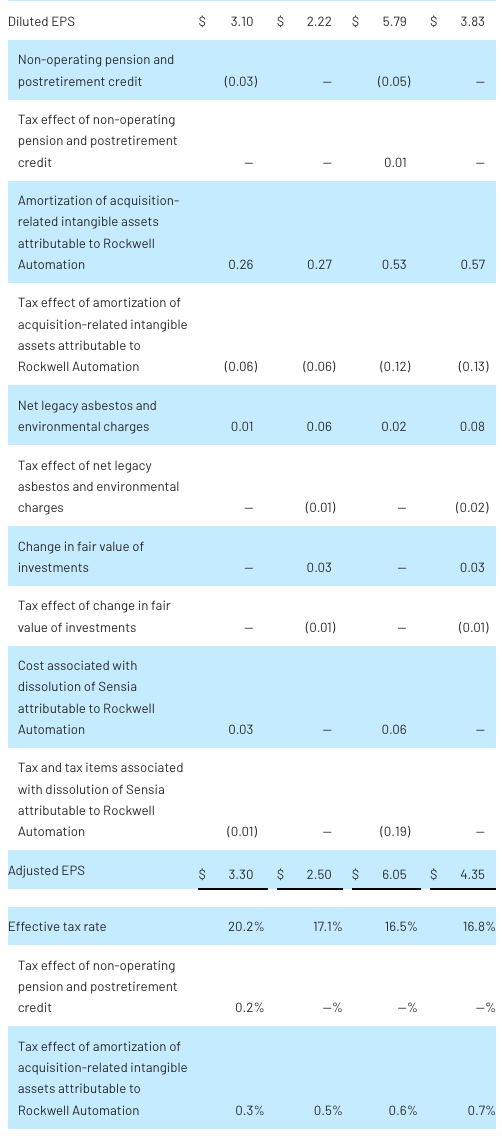
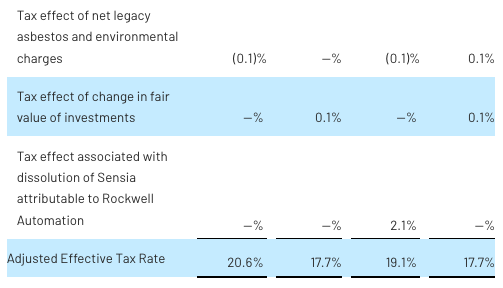
Tax – On a GAAP basis, the effective tax rate in the second quarter of fiscal 2026 was 20.2% compared to 17.1% in the second quarter of fiscal 2025. The Adjusted Effective Tax Rate for the second quarter of fiscal 2026 was 20.6% compared to 17.7% in the prior year. The increase in the effective tax rate and the Adjusted Effective Tax Rate was primarily due to the application of BEPS Pillar Two minimum tax rules.
Share repurchases – During the second quarter of fiscal 2026, the Company repurchased approximately 1.2 million shares of its common stock at a cost of $454 million. At March 31, 2026, approximately $318 million remained available under our existing share repurchase authorization.
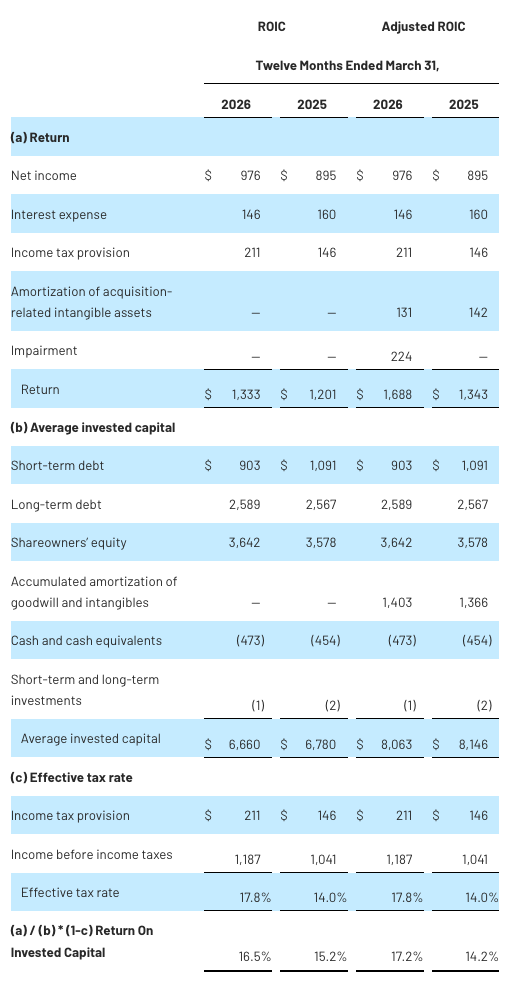
Return on Invested Capital (ROIC) – On a GAAP basis, ROIC was 16.5% for the twelve months ended March 31, 2026, compared to 15.2% for the twelve months ended March 31, 2025. Adjusted ROIC was 17.2% for the twelve months ended March 31, 2026, compared to 14.2% for the twelve months ended March 31, 2025.
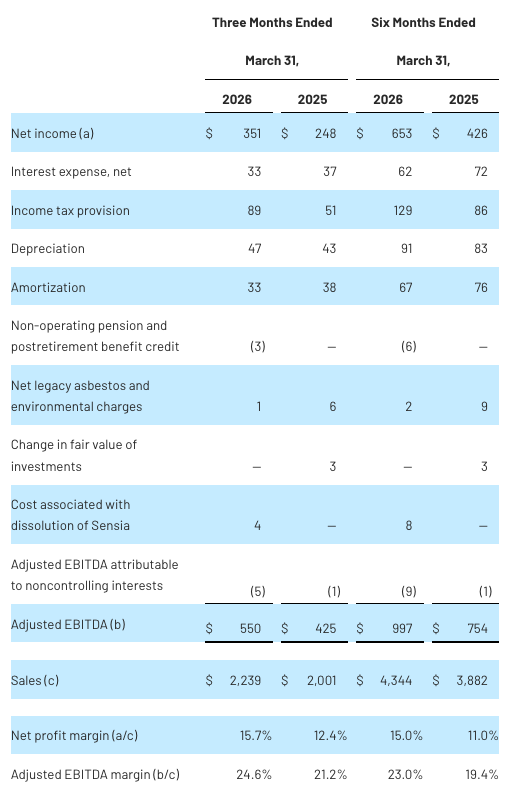
Net Income and Adjusted EBITDA – Net Income was $351 million for the three months ended March 31, 2026, compared to $248 million for the three months ended March 31, 2025. Adjusted EBITDA was $550 million for the three months ended March 31, 2026, compared to $425 million for the three months ended March 31, 2025. The increase was primarily driven by higher net income.
Definitions
Non-GAAP Measures – Organic sales, Enterprise operating profit, Enterprise operating margin, Adjusted Income, Adjusted EPS, Adjusted Effective Tax Rate, free cash flow, free cash flow conversion, Adjusted ROIC, Adjusted EBITDA, and Adjusted EBITDA margin are non-GAAP measures that are reconciled to GAAP measures in the attachments to this release.
Total ARR – Annual recurring revenue (ARR) is a key metric that enables measurement of progress in growing our recurring revenue business. It represents the annual contract value of all active recurring revenue contracts at any point in time. Recurring revenue is defined as a revenue stream that is contractual, typically for a period of 12 months or more, and has a high probability of renewal. The probability of renewal is based on historical renewal experience of the individual revenue streams, or management’s best estimates if historical renewal experience is not available. Total ARR growth is calculated as the dollar change in ARR, adjusted to exclude the effects of currency, divided by ARR as of the prior period. The effects of currency translation are excluded by calculating Total ARR on a constant currency basis. Total ARR includes acquisitions even if there was no comparable ARR in the prior period. We believe that Total ARR provides useful information to investors because it reflects our recurring revenue performance period over period including the effect of acquisitions. Our measure of ARR may be different from measures used by other companies. Because ARR is based on annual contract value, it does not represent revenue recognized during a particular reporting period or revenue to be recognized in future reporting periods and is not intended to be a substitute for revenue, contract liabilities, or backlog.
Organic ARR – Organic annual recurring revenue is Total ARR that excludes comparable ARR in the prior period for the divested businesses.
Conference Call
A conference call to discuss the quarterly results will be held at 8:30 a.m. Eastern Time on May 5, 2026. This call will be an audio webcast and accessible on the Rockwell Automation website (https://www.rockwellautomation.com/en-us/company/investor-relations.html). Presentation materials will also be available on the website prior to the call.
Interested parties can access the conference call by using the following numbers: (888) 330-2022 in North America; (365) 977-0051 in Canada; +1 (646) 960-0690 for other countries. Use the following passcode: 5499533. Please call in 10 minutes prior to the start of the call.
A replay of the call will be available on the Investor Relations section of the Rockwell website through June 5, 2026.
This news release contains statements (including certain projections and business trends) that are “forward-looking statements” as defined in the Private Securities Litigation Reform Act of 1995. Words such as “believe”, “estimate”, “project”, “plan”, “expect”, “anticipate”, “will”, “intend”, and other similar expressions may identify forward-looking statements. Actual results may differ materially from those projected as a result of certain risks and uncertainties, many of which are beyond our control, including but not limited to:
- macroeconomic factors, including inflation, global and regional business conditions (including adverse impacts in certain markets, such as Oil & Gas), commodity prices, currency exchange rates, the cyclical nature of our customers’ capital spending, and sovereign debt concerns;
- laws, regulations, and governmental policies affecting our activities in the countries where we do business, including those related to trade policies, including tariffs, taxation, trade controls, cybersecurity, and climate change;
- the severity and duration of disruptions to our business due to natural disasters (including those as a result of climate change), pandemics, acts of war, strikes, terrorism, social unrest or other causes;
- the availability and price of components and materials;
- our ability to manage and mitigate the risk related to security vulnerabilities and breaches of our hardware and software products, solutions, and services;
- the availability, effectiveness, and security of our information technology systems;
- the successful execution of our cost productivity and margin expansion initiatives;
- our ability to attract, develop, and retain qualified employees;
- the successful integration and management of strategic transactions and achievement of the expected benefits of these transactions;
- the successful development of advanced technologies and demand for and market acceptance of new and existing hardware and software products;
- our ability to manage and mitigate the risks associated with our solutions and services businesses;
- competitive hardware and software products, solutions, and services, pricing pressures, and our ability to provide high quality products, solutions, and services;
- the availability and cost of capital;
- disruptions to our distribution channels or the failure of distributors to develop and maintain capabilities to sell our products;
- intellectual property infringement claims by others and the ability to protect our intellectual property;
- the uncertainty of claims by taxing authorities in the various jurisdictions where we do business;
- the uncertainties of litigation, including liabilities related to the safety and security of the hardware and software products, solutions, and services we sell;
- our ability to manage costs related to employee retirement and health care benefits; and
- other risks and uncertainties, including but not limited to those detailed from time to time in our Securities and Exchange Commission (SEC) filings.
ROCKWELL AUTOMATION, INC.
CONDENSED STATEMENT OF OPERATIONS INFORMATION
(in millions, except percentages)
ROCKWELL AUTOMATION, INC.
SALES AND EARNINGS INFORMATION
(in millions, except per share amounts and percentages)
ROCKWELL AUTOMATION, INC.
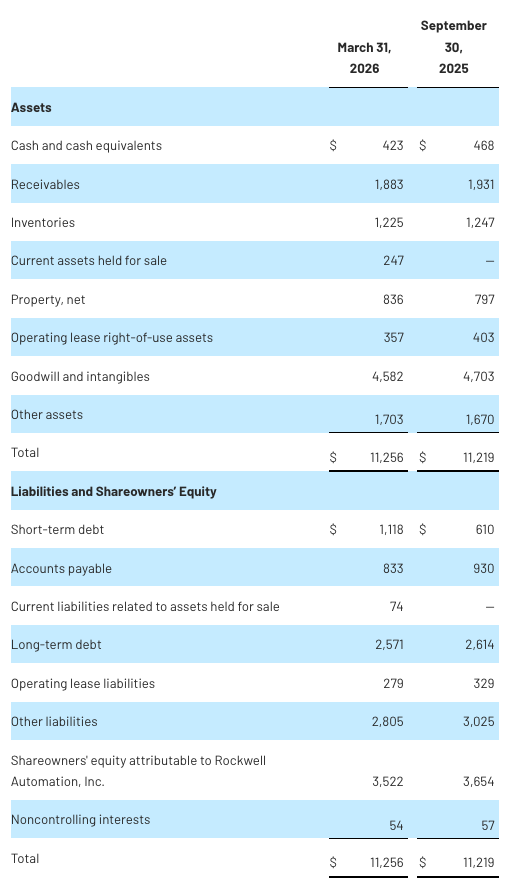
CONDENSED BALANCE SHEET INFORMATION
(in millions)
ROCKWELL AUTOMATION, INC.
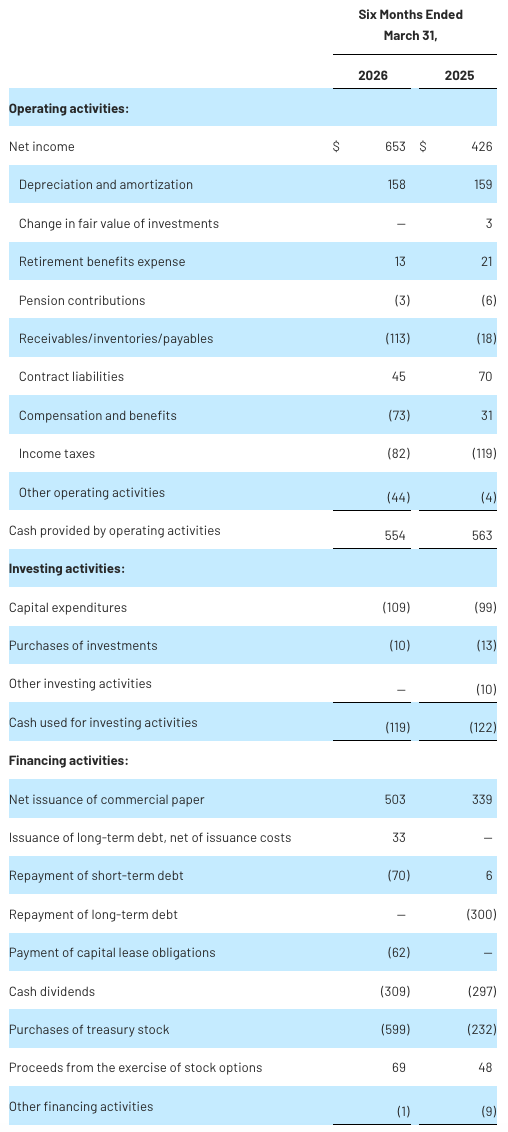
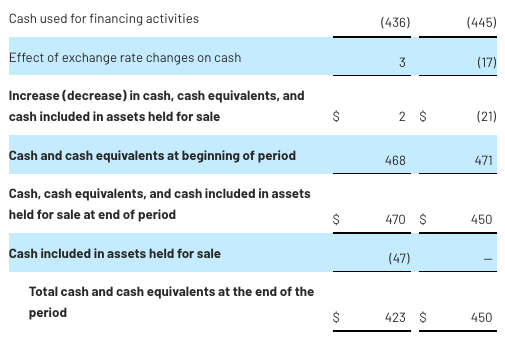
CONDENSED CASH FLOW INFORMATION
(in millions)
ROCKWELL AUTOMATION, INC.
OTHER SUPPLEMENTAL INFORMATION
(in millions, except percentages)
Organic Sales
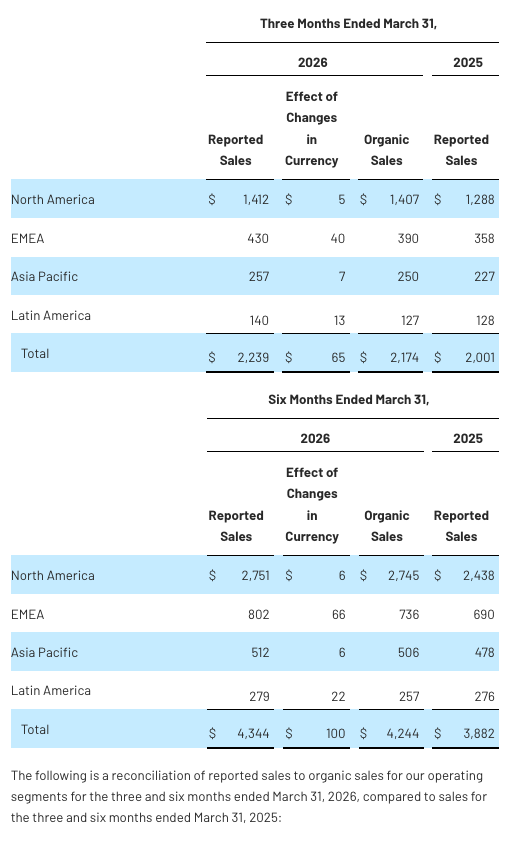
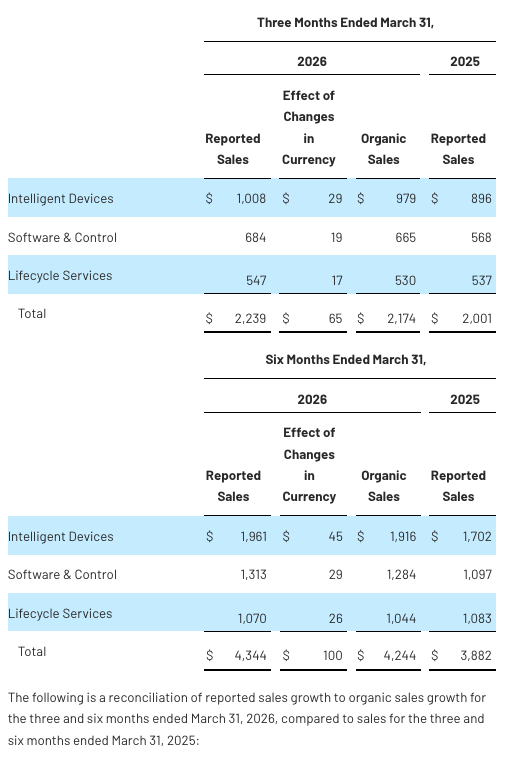
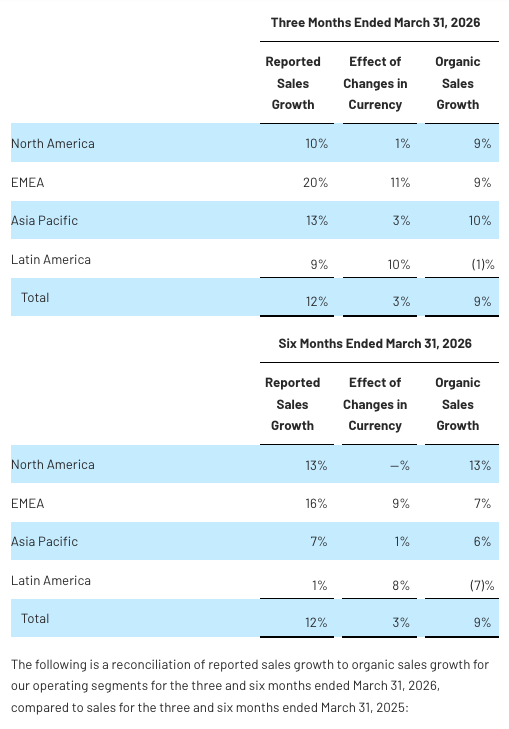
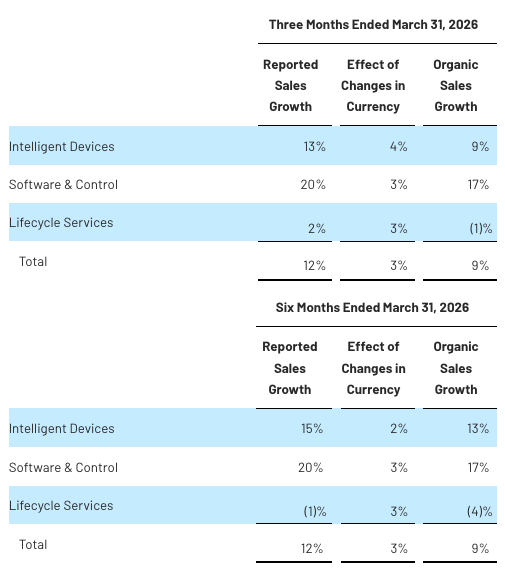
We translate sales of subsidiaries operating outside of the United States using exchange rates effective during the respective period. Therefore, changes in currency exchange rates affect our reported sales. Sales by acquired businesses also affect our reported sales. We believe that organic sales, defined as sales excluding the effects of acquisitions, and changes in currency exchange rates, which is a non-GAAP financial measure, provides useful information to investors because it reflects regional and operating segment performance from the activities of our businesses without the effect of acquisitions and changes in currency exchange rates. We use organic sales as one measure to monitor and evaluate our regional and operating segment performance. When we acquire businesses, we exclude sales in the current period for which there are no comparable sales in the prior period. We determine the effect of changes in currency exchange rates by translating the respective period’s sales using the same currency exchange rates that were in effect during the prior year. When we divest a business, we exclude sales in the prior period for which there are no comparable sales in the current period. Organic sales growth is calculated by comparing organic sales to reported sales in the prior year, excluding divestitures. We attribute sales to the geographic regions based on the country of destination.
The following is a reconciliation of reported sales to organic sales for the three and six months ended March 31, 2026, compared to sales for the three and six months ended March 31, 2025:
ROCKWELL AUTOMATION, INC.
OTHER SUPPLEMENTAL INFORMATION
(in millions, except per share amounts and percentages)
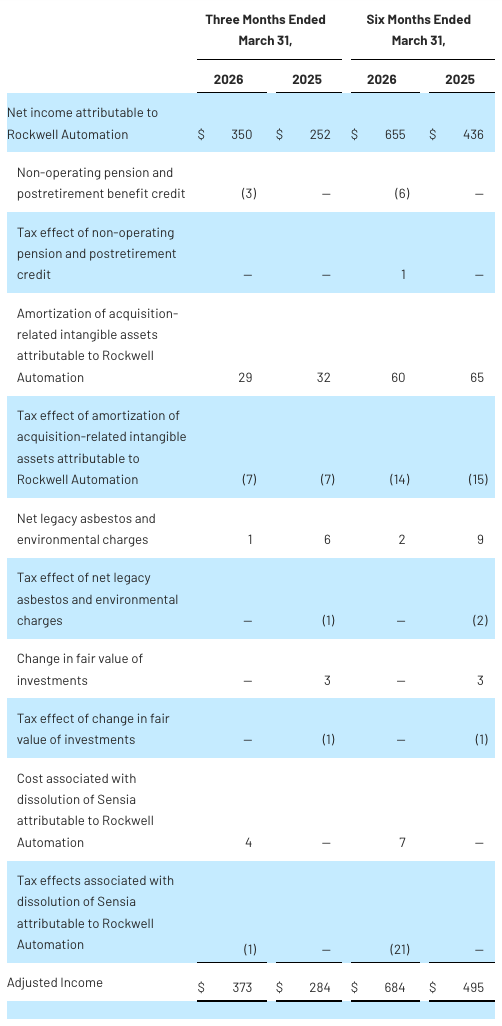
Adjusted Income, Adjusted EPS, and Adjusted Effective Tax Rate
Adjusted Income, Adjusted EPS, and Adjusted Effective Tax Rate are non-GAAP earnings measures that exclude non-operating pension and postretirement benefit credit, amortization of acquisition-related intangible assets, net legacy asbestos and environmental charges, cost and tax items associated with dissolution of Sensia attributable to Rockwell Automation, change in fair value of investments, and restructuring charges aligned with enterprise-wide strategic initiatives, including their respective tax effects. Non-operating pension and postretirement benefit credit is defined as all components of our net periodic pension and postretirement benefit cost except for service cost.
The Company adjusts its non-GAAP results to exclude Amortization of acquisition-related intangible assets as such amounts are significantly impacted by the timing and/or size of acquisitions. Management believes that the adjustment of Amortization of acquisition-related intangible assets supplements the GAAP information with a measure that can be used to assess the comparability of operating performance between periods and as compared to industry peers. Although the Company excludes Amortization of acquisition-related intangible assets from its non-GAAP expenses, management believes that it is important for investors to understand that such intangible assets were recorded as part of an acquisition and contribute to revenue generation.
In fiscal 2026, we updated the definition of our non-GAAP earnings measures to exclude cost, net of tax, and tax items associated with the April 1, 2026 dissolution of the Sensia joint venture. We believe the change to our definition provides a more useful presentation of our operating performance to investors as these costs and tax effects are not reflective of our ongoing operations. We did not revise prior years because there were no similar amounts.
We believe that Adjusted Income, Adjusted EPS, and Adjusted Effective Tax Rate provide useful information to our investors about our operating performance and allow management and investors to compare our operating performance period over period. Adjusted EPS is also used as a financial measure of performance for our annual incentive compensation. Our measures of Adjusted Income, Adjusted EPS, and Adjusted Effective Tax Rate may be different from measures used by other companies. These non-GAAP measures should not be considered a substitute for Net income attributable to Rockwell Automation, diluted EPS, and effective tax rate.
The following are the components of operating and non-operating pension and postretirement benefit cost (credit):
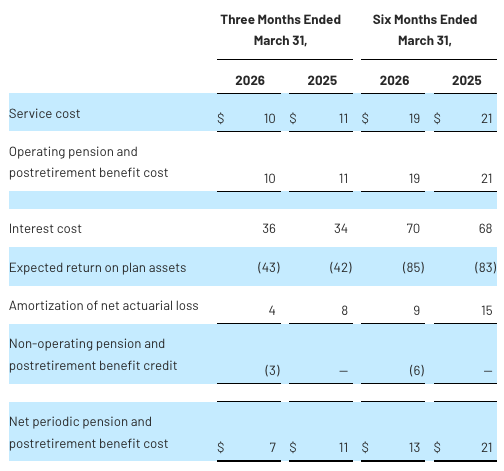
The components of net periodic pension and postretirement benefit cost other than the service cost component are included in Other income in the Condensed Statement of Operations.
Amortization of acquisition-related intangible assets and non-operating pension and postretirement benefit credit are not allocated to our operating segments because these costs are excluded from our measurement of each segment’s operating performance for internal purposes. If we were to allocate these costs, we would attribute them to each of our segments as follows (in millions):
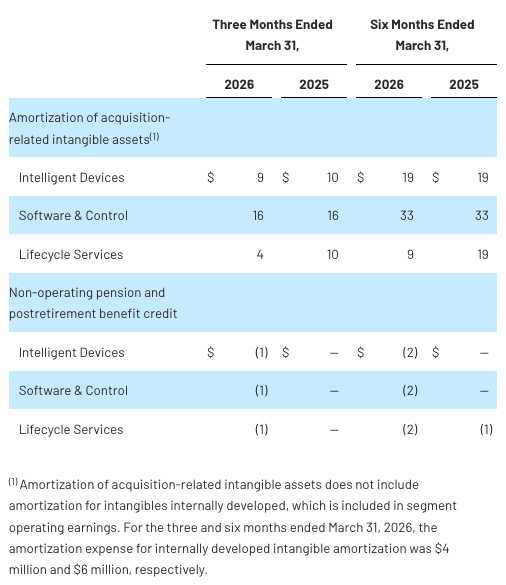
The following are reconciliations of Net income attributable to Rockwell Automation, diluted EPS, and effective tax rate to Adjusted Income, Adjusted EPS, and Adjusted Effective Tax Rate, respectively:
Fiscal 2026 Guidance
ROCKWELL AUTOMATION, INC.
OTHER SUPPLEMENTAL INFORMATION
(in millions, except percentages)
Free Cash Flow
Our definition of free cash flow, which is a non-GAAP financial measure, takes into consideration capital investments required to maintain the operations of our businesses and execute our strategy. In our opinion, free cash flow provides useful information to investors regarding our ability to generate cash from business operations that is available for acquisitions and other investments, service of debt principal, dividends, and share repurchases. We use free cash flow, as defined, as one measure to monitor and evaluate our performance, including as a financial measure for our annual incentive compensation. Our definition of free cash flow may be different from definitions used by other companies.
The following table summarizes free cash flow by quarter:
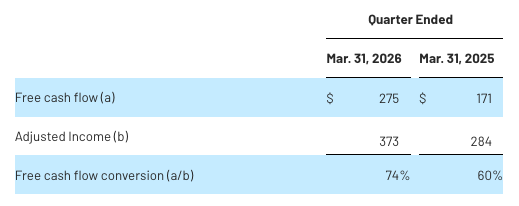
Free cash flow conversion (free cash flow as a percentage of Adjusted Income) is a non-GAAP financial measure, which reflects our ability to generate cash from the operations of our business while considering the capital investments required to maintain operations and execute our strategy as a ratio of our operating performance. We believe free cash flow conversion provides useful information to investors about our ability to convert operating performance into cash generation. Our measure of free cash flow conversion may be different from measures used by other companies.
The table below provides free cash flow conversion for the three months ended March 31, 2026 and 2025:
Return On Invested Capital and Adjusted Return On Invested Capital
Our press release contains information regarding Adjusted ROIC, which is a non-GAAP financial measure. We believe that Adjusted ROIC is useful to investors as a measure of performance and of the effectiveness of the use of capital in our operations. We use Adjusted ROIC as one measure to monitor and evaluate our performance. Our measure of Adjusted ROIC may be different from that used by other companies. We define Adjusted ROIC as the percentage resulting from the following calculation:
(a) net income, before interest expense, income tax provision, amortization of acquisition-related intangible assets, and goodwill and intangible asset impairment divided by;
(b) average invested capital for the year, calculated as a five quarter rolling average using the sum of short-term debt, long-term debt, shareowners’ equity, and accumulated amortization of goodwill and other intangible assets, minus cash and cash equivalents, short-term investments, and long-term investments (fixed income securities), multiplied by;
(c) one minus the effective tax rate for the period.
ROIC and Adjusted ROIC are calculated as follows (in millions, except percentages):
Adjusted EBITDA
Adjusted EBITDA and Adjusted EBITDA margin are non-GAAP financial measures. We believe that Adjusted EBITDA and Adjusted EBITDA margin provide investors with additional insight into our financial results and operating trends by excluding non-operational, non-recurring, and non-cash items. We use Adjusted EBITDA and Adjusted EBITDA margin as measures to monitor and evaluate our performance. We define Adjusted EBITDA as net income before interest expense, net, income tax provision, depreciation, amortization, goodwill and intangible asset impairment, non-operating pension and postretirement benefit credit, net legacy asbestos and environmental charges, change in fair value of investments, cost associated with dissolution of Sensia, restructuring charges aligned with enterprise-wide strategic initiatives, and Adjusted EBITDA attributable to non-controlling interests. Our measures of Adjusted EBITDA and Adjusted EBITDA margin may be different from those used by other companies, and Adjusted EBITDA and Adjusted EBITDA margin are not substitutes for net income, net profit margin, or any other measure calculated in accordance with GAAP.
The following is a reconciliation of Net income to Adjusted EBITDA and net profit margin to Adjusted EBITDA margin (in millions, except percentages):
SourceRockwell Automation
EMR Analysis
More information on Rockwell Automation: See the full profile on EMR Executive Services
More information on Blake Moret (Chairman and Chief Executive Officer, Rockwell Automation): See the full profile on EMR Executive Services
More information on Christian Rothe (Senior Vice President and Chief Financial Officer, Rockwell Automation): See the full profile on EMR Executive Services
More information on Aijana Zellner (Vice President, Investor Relations and Market Strategy, Rockwell Automation): See the full profile on EMR Executive Services
EMR Additional Financial Notes:
- Major financial KPI’s since 2017 are available on EMR Executive Services under “Financial Results” and comparison with peers under “Market Positioning”.
- Companies’ full profile on EMR Executive Services are based on their official press releases, quarterly financial reports, annual reports and other official documents.
- All members of the Executive Committee and of the Board have their full profile on EMR Executive Services
- The Rockwell Automation Q2 Fiscal 2026 Earnings Presentation can be found here: https://www.rockwellautomation.com/content/dam/rockwell-automation/documents/pdf/company/about-us/ir/2026/q2-2026-earnings-presentation.pdf
- The Rockwell Automation Q1 Fiscal 2026 Earnings Presentation can be found here: https://www.rockwellautomation.com/content/dam/rockwell-automation/documents/pdf/company/about-us/ir/2026/FY26-Q1-Charts.pdf
- The Rockwell Automation Annual Report 2025 can be found here: https://www.rockwellautomation.com/en-us/company/investor-relations/annual-reports.html
- The Rockwell Automation Q4 Fiscal 2025 Earnings Presentation can be found here: https://www.rockwellautomation.com/content/dam/rockwell-automation/documents/pdf/company/about-us/ir/2026/FY26-Q1-Charts.pdf
- The Rockwell Automation Annual Report 2024 on Form 10-K can be found here: https://d18rn0p25nwr6d.cloudfront.net/CIK-0001024478/ea22f616-21a6-4cac-89f3-bbc2695b0918.pdf
- The Rockwell Automation Q4 Fiscal 2024 Earnings Presentation can be found here: https://www.rockwellautomation.com/content/dam/rockwell-automation/documents/pdf/company/about-us/ir/2024/Q4FY24-Charts.pdf
- The Rockwell Automation Investor Day Presentation of the 8th of November 2023 can be found here: https://www.rockwellautomation.com/en-us/company/investor-relations.html
- The Rockwell Automation Annual Report 2023 on Form 10-K can be found here: https://d18rn0p25nwr6d.cloudfront.net/CIK-0001024478/d6fa8cb3-522c-4d8e-b452-1b699920b583.pdf
- The Rockwell Automation Q4 2023 Presentation can be found here: https://www.rockwellautomation.com/content/dam/rockwell-automation/documents/pdf/company/about-us/ir/2023/FY23%20Q4%20and%20Full%20Year%20Charts_Final.pdf
- The Rockwell Automation Annual Report 2022 can be found here: https://s21.q4cdn.com/683968908/files/doc_financials/2022/ar/ROK019_Rockwell-Automation_2022-Annual-Report_Web.pdf