Nexans partners with Signify to foster our decarbonation journey in Europe


Europe is committed to reaching climate neutrality by 2050, and 35% of greenhouse gas emission reduction can be achieved by energy efficiency alone.
As part of its climate strategy, Nexans has committed to Net-Zero emissions by 2050. For the renovation of its industrial park’s lighting in Europe, the Group chose a solution that is both agile and resilient.
Nexans initiated with Signify formerly known as Philips Lighting, the renovation of its lighting to move to LED in 12 of its sites in Europe, allowing the Group to reduce carbon footprint by 1,400 tons of CO2 equivalent overall per year. This partnership with Signify is a perfect example of how our suppliers – who are an integral part of the Group’s ecosystem, contribute to our roadmap.
Signify’s Light as a Service solution helps Nexans to optimize our costs, reduce our carbon footprint and improve our workers’ conditions, in compliance with Nexans E3 performance measurement approach. This is key for our Group, because we are combining these three pillars in one.
David Grall, VP SUSTAINABILITY, NEXANS
This project is part of a European initiative called Efficiency as a Service (EaaS), led by the Basel Agency for Sustainable Energy (BASE) and part of the global Servitisation for Energy Transition (SET) Alliance, which operates on a pay-per-use model. Instead of paying for the actual product or infrastructure, customers only pay for the service they receive. The main goal of this project is to make it easier for companies to switch to energy-efficient solutions and speed up their adoption in the built environment.
Thanks to this model, Nexans achieves immediate savings on its consumption of electricity without having to invest in a new facility lighting system.
Spotlight on Cortaillod facility
Our historical site of Cortaillod, in Switzerland, represents one of our best-class facility for this lighting renovation initiative, as the plant has reduced its emissions by 300 tons equivalent CO2.
Watch the full video and discover the testimonies of Nexans Switzerland employees and how changing the lighting in their environment – factory or office, improved their working conditions.
One of the major advantages was improving the lighting: it was not just a one-for-one replacement but rather considering – according to each workstation, the places where lighting could be reduced and where it should be increased.
Yves Ruedin, INDUSTRIAL PROJECT ENGINEER, NEXANS
SourceNexans
EMR Analysis
More information on Nexans: See the full profile on EMR Executive Services
More information on Christopher Guérin (Chief Executive Officer, Nexans + President, Europacable): See the full profile on EMR Executive Services
More information on the E3 Ambition of Nexans: See the full profile on EMR Executive Services
More information on David Grall (Vice President, Sustainability & Corporate Transformation, Nexans): See the full profile on EMR Executive Services
More information on Yves Ruedin (Industrial Project Engineer, Nexans Switzerland, Nexans): See the full profile on EMR Executive Services
More information on Signify: See the full profile on EMR Executive Services
More information on Eric Rondolat (Chief Executive Officer, Signify): See the full profile on EMR Executive Services
More information on Net Zero by 2050 by the United Nations: https://www.un.org/en/climatechange/net-zero-coalition + Put simply, net zero means cutting greenhouse gas emissions to as close to zero as possible, with any remaining emissions re-absorbed from the atmosphere, by oceans and forests for instance.
Currently, the Earth is already about 1.1°C warmer than it was in the late 1800s, and emissions continue to rise. To keep global warming to no more than 1.5°C – as called for in the Paris Agreement – emissions need to be reduced by 45% by 2030 and reach net zero by 2050.
More than 140 countries, including the biggest polluters – China, the United States, India and the European Union – have set a net-zero target, covering about 88% of global emissions. More than 9,000 companies, over 1000 cities, more than 1000 educational institutions, and over 600 financial institutions have joined the Race to Zero, pledging to take rigorous, immediate action to halve global emissions by 2030.
More information on the Efficiency as a Service (EaaS) European initiative: https://www.eaas-initiative.org/ + EaaS is a pay-per-use model where the end-customers only pay for the service they receive, rather than the physical product or infrastructure that delivers the service.
In June 2020, BASE, AGORIA, ANESE and Innoenergy with funding received from the European Union’s Horizon 2020 research and innovation programme launched the Efficiency as a Service (EaaS) initiative. The project aims to develop and deploy the servitisation (or pay-per-use) model and a financial structure to enable the transition and accelerate the market adoption of energy efficient solutions by Small and Medium-sized Enterprises (SMEs) in Belgium, the Netherlands and Spain. EaaS is a pay-per-use model where the end-customers only pay for the service they receive, rather than the physical product or infrastructure that delivers the service. In this case, the technology provider installs and maintains the equipment and recovers costs through periodic customer payments. These payments are fixed-cost-per-unit for the energy efficient service delivered (for example, euros per cubic meter of compressed air, per tonne of refrigeration, or hours of lighting), and are based on actual usage.
The EaaS model creates conditions for SMEs to access new climate-friendlier technologies without the need to provide up-front capital investment for more efficient and more expensive equipment.
More information on the Basel Agency for Sustainable Energy (BASE): https://energy-base.org/ + Established in 2001, BASE is a Swiss foundation and Specialized Partner of United Nations Environment.
We develop innovative, actionable financial strategies and market-driven solutions to unlock investment in climate change solutions. Around the world, we work with all markets and segments including those that are challenging and underserved.
BASE combines expertise in technology, markets, economics, finance and business development to deliver effective solutions for every project. We build bridges between sectors and actors at the nexus between sustainable energy, finance and international development.
Our vision is a world where markets are transformed and climate change solutions are the norm, not the exception.
More information on Gina Domanig (President of the Foundation Board, BASE): https://energy-base.org/team-archive/ + https://www.linkedin.com/in/gina-domanig/
More information on Daniel Magallón (Managing Director, BASE): https://energy-base.org/team-archive/ + https://www.linkedin.com/in/magallon/
More information on the global Servitisation for Energy Transition (SET) Alliance: https://set-alliance.org/ + Network of visionary organizations dedicated to accelerating the deployment of clean and energy efficient solutions “as-a-service”.
EMR Additional Notes:
- Global Warming: Global warming is the long-term heating of Earth’s climate system observed since the pre-industrial period (between 1850 and 1900) due to human activities, primarily fossil fuel burning, which increases heat-trapping greenhouse gas levels in Earth’s atmosphere.
- Global Warming Potential (GWP):
- The heat absorbed by any greenhouse gas in the atmosphere, as a multiple of the heat that would be absorbed by the same mass of carbon dioxide (CO2). GWP is 1 for CO2. For other gases it depends on the gas and the time frame.
- Carbon dioxide equivalent (CO2e or CO2eq or CO2-e) is calculated from GWP. For any gas, it is the mass of CO2 which would warm the earth as much as the mass of that gas. Thus it provides a common scale for measuring the climate effects of different gases. It is calculated as GWP times mass of the other gas. For example, if a gas has GWP of 100, two tonnes of the gas have CO2e of 200 tonnes.
- GWP was developed to allow comparisons of the global warming impacts of different gases.
- Greenhouse Gas (GHG):
- A greenhouse gas is any gaseous compound in the atmosphere that is capable of absorbing infrared radiation, thereby trapping and holding heat in the atmosphere. By increasing the heat in the atmosphere, greenhouse gases are responsible for the greenhouse effect, which ultimately leads to global warming.
- The main gases responsible for the greenhouse effect include carbon dioxide, methane, nitrous oxide, and water vapor (which all occur naturally), and fluorinated gases (which are synthetic).

- Hydrofluorocarbons (HFC):
- Hydrofluorocarbons (HFCs) are a group of industrial chemicals primarily used for cooling and refrigeration. HFCs were developed to replace stratospheric ozone-depleting substances that are currently being phased out under the Montreal Protocol on Substances that Deplete the Ozone Layer.
- Many HFCs are very powerful greenhouse gases and a substantial number are short-lived climate pollutants with a lifetime of between 15 and 29 years in the atmosphere.
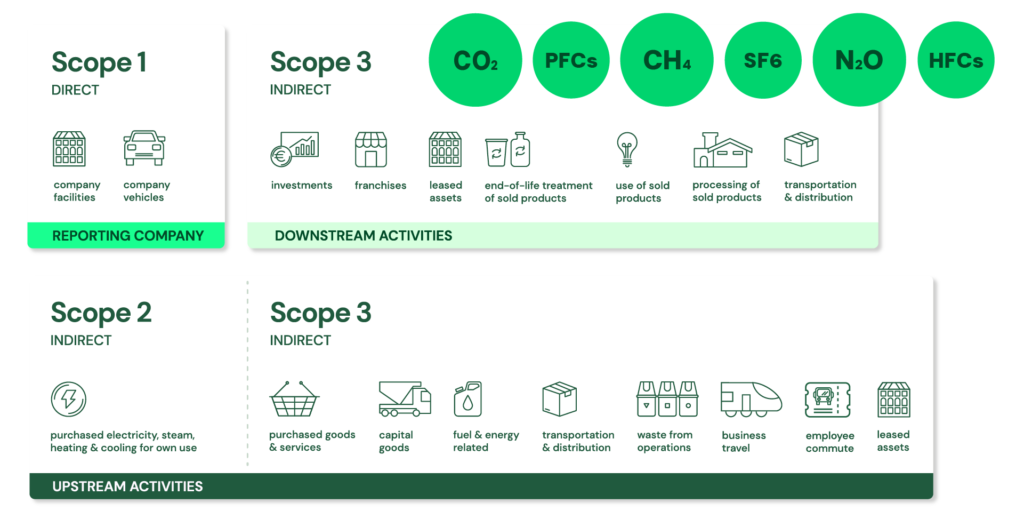
- GHG Protocol Corporate Standard Scope 1, 2 and 3: https://ghgprotocol.org/ + The GHG Protocol Corporate Accounting and Reporting Standard provides requirements and guidance for companies and other organizations preparing a corporate-level GHG emissions inventory. Scope 1 and 2 are mandatory to report, whereas scope 3 is voluntary and the hardest to monitor.
- Scope 1: Direct emissions:
- Direct emissions from company-owned and controlled resources. In other words, emissions are released into the atmosphere as a direct result of a set of activities, at a firm level. It is divided into four categories:
- Stationary combustion (e.g fuels, heating sources). All fuels that produce GHG emissions must be included in scope 1.
- Mobile combustion is all vehicles owned or controlled by a firm, burning fuel (e.g. cars, vans, trucks). The increasing use of “electric” vehicles (EVs), means that some of the organisation fleets could fall into Scope 2 emissions.
- Fugitive emissions are leaks from greenhouse gases (e.g. refrigeration, air conditioning units). It is important to note that refrigerant gases are a thousand times more dangerous than CO2 emissions. Companies are encouraged to report these emissions.
- Process emissions are released during industrial processes, and on-site manufacturing (e.g. production of CO2 during cement manufacturing, factory fumes, chemicals).
- Direct emissions from company-owned and controlled resources. In other words, emissions are released into the atmosphere as a direct result of a set of activities, at a firm level. It is divided into four categories:
- Scope 2: Indirect emissions – owned:
- Indirect emissions from the generation of purchased energy, from a utility provider. In other words, all GHG emissions released in the atmosphere, from the consumption of purchased electricity, steam, heat and cooling. For most organisations, electricity will be the unique source of scope 2 emissions. Simply stated, the energy consumed falls into two scopes: Scope 2 covers the electricity consumed by the end-user. Scope 3 covers the energy used by the utilities during transmission and distribution (T&D losses).
- Scope 3: Indirect emissions – not owned:
- Indirect emissions – not included in scope 2 – that occur in the value chain of the reporting company, including both upstream and downstream emissions. In other words, emissions are linked to the company’s operations. According to GHG protocol, scope 3 emissions are separated into 15 categories.
- Scope 1: Direct emissions:
- Carbon Dioxide (CO2):
- Primary greenhouse gas emitted through human activities. Carbon dioxide enters the atmosphere through burning fossil fuels (coal, natural gas, and oil), solid waste, trees and other biological materials, and also as a result of certain chemical reactions (e.g., manufacture of cement). Carbon dioxide is removed from the atmosphere (or “sequestered”) when it is absorbed by plants as part of the biological carbon cycle.
- Biogenic Carbon Dioxide (CO2):
- Carbon Dioxide released as a result of the combustion or decomposition of organic material, that is biomass and its derivatives. Examples include carbon dioxide released during the combustion of wood and biogas generated by decomposition.
- Biogenic Carbon Dioxide (CO2) and Carbon Dioxide (CO2) are the same. Scientists differentiate between biogenic carbon (that which is absorbed, stored and emitted by organic matter like soil, trees, plants and grasses) and non-biogenic carbon (that found in all other sources, most notably in fossil fuels like oil, coal and gas).
- Carbon Capture and Storage (CCS):
- CCS involves the capture of carbon dioxide (CO2) emissions from industrial processes, such as steel and cement production, or from the burning of fossil fuels in power generation. This carbon is then transported from where it was produced, via ship or in a pipeline, and stored deep underground in geological formations.
- CCS projects typically target 90 percent efficiency, meaning that 90 percent of the carbon dioxide from the power plant will be captured and stored.
- Decarbonization:
- Reduction of carbon dioxide emissions through the use of low carbon power sources, achieving a lower output of greenhouse gasses into the atmosphere.
- Carbon Footprint:
- There is no universally agreed definition of what a carbon footprint is. A carbon footprint is generally understood to be the total amount of greenhouse gas (GHG) emissions that are directly or indirectly caused by an individual, organization, product, or service. These emissions are typically measured in tonnes of carbon dioxide equivalent (CO2e).
- In 2009, the Greenhouse Gas Protocol (GHG Protocol) published a standard for calculating and reporting corporate carbon footprints. This standard is widely accepted by businesses and other organizations around the world. The GHG Protocol defines a carbon footprint as “the total set of greenhouse gas emissions caused by an organization, directly and indirectly, through its own operations and the value chain.”
- LED:
- LED stands for light emitting diode. LED lighting products produce light up to 90% more efficiently than incandescent light bulbs. How do they work? An electrical current passes through a microchip, which illuminates the tiny light sources we call LEDs and the result is visible light.
- A light-emitting diode is a semiconductor light source that emits light when current flows through it. Electrons in the semiconductor recombine with electron holes, releasing energy in the form of photons.
- LED vs. Halogen:
- Halogen bulbs, while lasting longer than incandescent bulbs, only last up to 2,000 hours. In contrast, LED bulbs can last up to 25,000 hours, and LED tubes are rated for up to 50,000 hours. LED bulbs can use as much as 80% percent less energy than halogen bulbs.
- There’s obviously a clear winner when it comes to LED vs halogen lighting. LED lights are more energy-efficient, have a longer lifespan, and offer more choices in color temperature. They do cost a little more, but their extremely long lifespan easily offsets the higher upfront cost.
- microLED:
- Compared to widespread LCD technology, microLED displays offer better contrast, response times, and energy efficiency. They are also capable of high speed modulation, and have been proposed for chip-to-chip interconnect applications.
- MicroLED prototype displays have been shown to offer up to 10 times more brightness than the best OLED panel while being significantly more power efficient, making them an exciting new technology in the world of displays.