Hager – Hager publishes its 2025/26 annual & sustainability report


- New report highlights measurable progress across Hager’s E3 strategy.
- More than a review of financial and sustainability performance, this year’s Annual & Sustainability Report serves as Hager’s central reference for transparent, audited sustainability information.
- Against a backdrop of continued economic and geopolitical uncertainty, Hager maintained stable turnover of €3.0 billion in 2025.
Measurable progress across Ethics, Employees and Environment
Hager continued to make measurable progress across its E3 sustainability strategy in 2025. Compared with the 2021 baseline, the company reduced its Scope 1 and 2 greenhouse gas emissions by 27% and Scope 3 emissions by 17%. Through its energy management businesses Eficia and Advizeo, Hager also enabled 1.4 TWh of customer energy savings, helping customers improve the energy performance of their buildings.
Daniel Hager, Chairman of the Supervisory Board, said: “Buildings shape the future for generations. That is why the values that have shaped us – courage, authenticity, and integrity – matter more than ever.”
Hager’s sustainability performance continues to receive external recognition. In 2025, the company was awarded EcoVadis Platinum for the second consecutive year, placing it among the top one percent of more than 130,000 assessed companies worldwide. Hager also achieved a CDP A- rating for its leadership in climate transparency and action.
“Sustainability and commercial ambition are not pointing in different directions. At Hager, they are the same direction. That is what makes our position so strong“, explained Sabine Busse, Chief Executive Officer.
Focus on developments in human sustainability
The report also highlights progress across the Ethics and Employees pillars. Internal mobility accounted for 30% of all open positions filled, reflecting Hager’s commitment to developing talent and fostering long-term careers. 81% of targeted permanent employees completed the Ethics Training Programme, while 21 Ethics Ambassadors are now active across ten countries.
Matthieu Alexandropoulos, Sustainability Director, commented: “Sustainability at Hager is a transformation practice. That is both less glamorous and more durable than any campaign.”
Supporting informed decisions
Alongside the Annual & Sustainability Report, Hager is launching Pulse, a new magazine designed for customers and partners. Available first in English, with French and German editions to follow, Pulse complements the report with concise insights, customer stories and business cases that support sustainability-related decision-making.
The 2025/26 Annual & Sustainability Report and the new Pulse magazine are now available on the Hager Global website.
SourceHager
EMR Analysis
More information on Hager Group: See the full profile on EMR Executive Services
More information on Daniel Hager (Chairman of the Supervisory Board, Hager Group + President, ZVEI + Member of the Extended Board, ZVEI + Chairman of the ZVEI Buildings Platform, ZVEI + Member of the Electrical Installation Systems Division, ZVEI + Member of the Board of Directors, Eiffage): See the full profile on EMR Executive Services
More information on Sabine Busse (Group Chief Executive Officer, Hager Group): See the full profile on EMR Executive Services
More information on Michael Flieger (Group Chief Financial Officer, Hager Group): See the full profile on EMR Executive Services
More information on the Sustainability Strategy 2030, E3, the CSR Approach and on the Sustainability Report 2025-26 by Hager Group: See the full profile on EMR Executive Services
More information on Franck Houdebert (Group Chief Human Resources Officer and the Board of Director’s Sustainability Ambassador, Hager Group): See the full profile on EMR Executive Services
More information on Matthieu Alexandropoulos (Senior Director, Corporate Social Responsibility (CSR), Hager Group): See the full profile on EMR Executive Services
More information on Eficia by Hager: See the full profile on EMR Executive Services
More information on Alric Marc (Chief Executive Officer, Eficia, Hager Group): See the full profile on EMR Executive Services
More information on Julien Bellynck (Managing Director, Eficia, Hager Group): See the full profile on EMR Executive Services
More information on advizeo by Hager Group: See the full profile on EMR Executive Services
More information on Cyril Sailly (Managing Director, advizeo, Hager Group): See the full profile on EMR Executive Services
More information on Xavier Gounon (Marketing Director, advizeo, Hager Group): See the full profile on EMR Executive Services
More information on PULSE Magazine by Hager Group: https://reports.hager.com/hager-pulse/2025-26/en/home
More information on EcoVadis: https://ecovadis.com + The World’s Most Trusted Business Sustainability Ratings.
Since its founding in 2007, EcoVadis has grown to become the world’s largest and most trusted provider of business sustainability ratings, creating a global network of more than 150,000+ rated companies.
Our team is composed of over 1900 highly-talented professionals from 80 nationalities.
The EcoVadis sustainability assessment methodology is at the heart of our Ratings and Scorecards and is an evaluation of how well a company has integrated the principles of Sustainability/CSR into their business and management system.
The EcoVadis sustainability assessment methodology is at the heart of our Ratings and Scorecards and is an evaluation of how well a company has integrated the principles of Sustainability/CSR into their business and management system.
Our methodology is built on international sustainability standards, including the Global Reporting Initiative, the United Nations Global Compact, and the ISO 26000, covering 250+ spend categories and 185+ countries. The Sustainability Scorecard illustrates performance across 21 indicators in four themes: Environment, Labor & Human Rights, Ethics and Sustainable Procurement.
EcoVadis medals are awarded to the top 35% of companies assessed by EcoVadis:
Medals are awarded based on the percentile rank of a company which is calculated at the time of scorecard publication. It compares a company’s performance with all rated companies in our database over the previous 12 months. The percentile rank is calculated across all companies in all industries, not per industry.
- Platinum – Top 1% (99+ percentile)
- Gold – Top 5% (95+ percentile)
- Silver – Top 15% (85+ percentile)
- Bronze – Top 35% (65+ percentile)
To be eligible for a medal, a company must achieve a minimum score of 30 in each of the four themes:
- Environment
- Ethics
- Labor & Human Rights
- Sustainable Procurement
More information on Pierre-François Thaler (Co-Founder & Co-Chief Executive Officer, EcoVadis + Co-Founder & Co-Chief Executive Officer, CyberVadis): https://ecovadis.com/leadership/ + https://www.linkedin.com/in/pfthaler/
More information on Frédéric Trinel (Co-Founder & Co-Chief Executive Officer, EcoVadis): https://ecovadis.com/leadership/
More information on the Carbon Disclosure Project (CDP): https://www.cdp.net/en + CDP is a global non-profit that runs the world’s only independent environmental disclosure system for companies, capital markets, cities, states and regions to manage their environmental impacts. We are repeatedly ranked as a market leader for quality and usefulness by sustainability professionals.
Founded in 2000, CDP was the first organization to leverage investor pressure to influence corporate disclosure on environmental impact. Now with the world’s largest, most comprehensive dataset on environmental action, the insights that CDP holds empower investors, companies, cities, and national and regional governments to make Earth-positive decisions.
As the founder of environmental reporting, we believe in transparency and the power of data to drive change, with the richest and most comprehensive dataset on corporate and state action. Partnering with leaders in enterprise, capital, policy and science, we surface the information needed to enable Earth-positive decisions.
Disclosure through CDP provides a window of opportunity for companies, cities, states, and regions to demonstrate their environmental progress over the past year and achieve a CDP score in the process.
Our disclosure system also integrates best-practice reporting standards and frameworks from the likes of ISSB and TNFD into one questionnaire, making it easier to share information back to the market in one dataset.
Environmental disclosure enables organizations to uncover data and insights that offer immediate value, while building long-term resilience.
Last year, over 23,100 organizations responded to the continued market demand for disclosure data. This year, we are laser-focused on simplifying the disclosure process with better guidance and other improvements.
Disclosers are evaluated across four scoring levels, representing stages of environmental maturity:
- Disclosure (D/D–): Measures the completeness of a company’s reporting. The number of points allocated to each question depends on both the amount of data requested and their relative importance to data users.
- Awareness (C/C–): Reflects the understanding of how environmental issues relate to the company’s activities and impacts. This level indicates awareness but not yet action.
- Management (B/B–): Recognizes evidence of action and processes to manage environmental issues, showing that the company is moving from understanding to implementation.
- Leadership (A/A–): Represents best practice performance, where the Discloser demonstrates environmental leadership through ambitious strategies, verified progress, and sector-leading action.
The response window is now open for the 2026 cycle.
More information on Paul Dickinson (Founder Chair, Carbon Disclosure Project (CDP) + Co-Founder, Transition Value Partners (TVP)): https://www.transition-value.com/about + https://www.linkedin.com/in/paul-dickinson-0093a8/
More information on Sherry Madera (Chief Executive Officer, CDP): https://www.cdp.net/en/about/team + https://www.linkedin.com/in/sherrymadera/
More information on the CDP Climate A List by Carbon Disclosure Project (CDP): https://www.cdp.net/en/data/scores + Explore the 2025 A Lists for companies, cities, states and regions, and public corporate scores.
- 22,100+ companies disclosed in 2025
- 899 companies made the 2025 Corporate A List – 5% of the nearly 20,000 companies scored
- 27 companies scored a Triple A
EMR Additional Notes:
- Carbon Dioxide (CO2):
- The primary greenhouse gas emitted through human activities. Carbon dioxide enters the atmosphere through the burning of fossil fuels (coal, natural gas, and oil), solid waste, biomass (e.g. wood), and also as a result of certain industrial chemical reactions (e.g. cement production).
- Carbon dioxide is removed from the atmosphere (or “sequestered”) when it is absorbed by plants as part of the biological carbon cycle and through ocean absorption and geological processes.
- CO₂ is naturally part of the carbon cycle, but human activities have significantly increased its concentration in the atmosphere.
- Biogenic Carbon Dioxide (CO2):
- Biogenic CO₂ and fossil-derived CO₂ are chemically identical molecules.
- The distinction is not chemical, but source-based:
- Biogenic carbon: CO₂ released from organic materials such as plants, wood, soil, and biomass that were recently part of the natural carbon cycle.
- Fossil carbon: CO₂ released from fossil fuels (coal, oil, gas), which were stored underground for millions of years.
- CO2e (Carbon Dioxide Equivalent):
- CO₂e means “carbon dioxide equivalent”.
- It is a standardized climate metric used to express the total climate impact of multiple greenhouse gases in a single standardized unit.
- CO₂e converts all greenhouse gases (such as methane and nitrous oxide) into the amount of CO₂ that would have the same global warming effect over a defined time period.
- Formula: CO₂e = mass of gas × Global Warming Potential (GWP)
- Carbon dioxide equivalents are commonly expressed as million metric tonnes of carbon dioxide equivalents, abbreviated as MMTCDE.
- The carbon dioxide equivalent for a gas is derived by multiplying the tonnes of the gas by the associated GWP: MMTCDE = (million metric tonnes of a gas) * (GWP of the gas).
- For example, the GWP for methane is 25 and for nitrous oxide 298. This means that emissions of 1 million metric tonnes of methane and nitrous oxide respectively is equivalent to emissions of 25 and 298 million metric tonnes of carbon dioxide.
- Carbon Footprint:
- There is no universally agreed definition of what a carbon footprint is.
- The most widely used definition (GHG Protocol) describes it as: “The total set of greenhouse gas (GHG) emissions caused directly and indirectly through an organization’s operations and value chain.”
- A carbon footprint is the total amount of greenhouse gas (GHG) emissions caused directly and indirectly by an individual, organization, product, or activity.
- It is typically measured in CO₂e.
- Decarbonization:
- Reduction of carbon dioxide emissions through the use of low-carbon energy sources and improved efficiency, with the goal of reducing overall greenhouse gas emissions.
- Decarbonization typically refers to system-wide transition, not only emission reduction at a single source.
- Carbon Credits or Carbon Offsets:
- Carbon credits are tradable certificates representing the right to emit one metric ton of CO₂e.
- They are part of cap-and-trade systems, where:
- A cap limits total emissions
- Companies receive or buy allowances
- Excess credits can be traded
- Offsets are often linked to external projects that reduce or remove emissions (e.g. reforestation, renewable energy).
- Carbon Capture and Storage (CCS) – Carbon Capture, Utilisation and Storage (CCUS):
- CCS involves capturing CO₂ emissions from industrial processes and storing them permanently in geological formations (e.g. underground reservoirs).
- CCUS adds a utilization step, where captured CO₂ is reused as a feedstock (e.g. fuels, chemicals, building materials).
- CCS = storage only, CCUS = storage + reuse.
- Carbon Dioxide Removal (CDR) or Durable Carbon Removal:
- CDR refers to methods that actively remove CO₂ from the atmosphere and store it for long periods in geological, biological, or mineral form.
- Examples include:
- Direct Air Capture (DAC)
- Bioenergy with Carbon Capture (BECCS)
- Enhanced Rock Weathering (ERW)
- CDR creates net negative emissions when removal exceeds emissions.
- Direct Air Capture (DAC):
- Technologies that extract CO2 directly from the atmosphere at any location, unlike carbon capture which is generally carried out at the point of emissions, such as a steel plant.
- Constraints like costs and energy requirements as well as the potential for pollution make DAC a less desirable option for CO2 reduction. Its larger land footprint when compared to other mitigation strategies like carbon capture and storage systems (CCS) also put it at a disadvantage.
- Direct Air Capture and Storage (DACCS):
- Climate technology that removes carbon dioxide (CO2) directly from the ambient atmosphere using large fans and chemical processes to bind with the CO2.
- Bioenergy with Carbon Capture and Storage (BECCS):
- Technology that generates energy from biomass while capturing and storing the resulting CO₂.
- Because biomass absorbs CO₂ while growing, BECCS can result in net negative emissions.
- Enhanced Rock Weathering (ERW):
- Carbon dioxide removal (CDR) technique that accelerates the natural process of rock weathering by grinding silicate rocks into dust and spreading it on land, typically agricultural fields. This process uses rainwater to convert atmospheric carbon dioxide into mineral carbonates, which are then stored long-term in soils, groundwater, and oceans.
- Limits of Carbon Dioxide Storage:
- Carbon storage is not endless; the Earth’s capacity for permanently storing vast amounts of captured carbon, particularly in geological formations, is limited, potentially reaching a critical limit of 1,460 gigatonnes at around 2200, though storage durations vary significantly depending on the method, from decades for some biological methods to potentially millions of years for others like mineralization. While some methods offer very long-term storage, the sheer volume needed to meet climate targets requires scaling up storage significantly beyond current capacity, raising concerns about the available volume over time.
- Carbon Impregnation:
- Carbon impregnation is the process of treating activated carbon with chemical agents (such as metals, acids, or bases) to enhance its ability to adsorb specific, hard-to-remove pollutants. By loading substances like silver, sulfur, or potassium hydroxide into its pores, this material combines physical adsorption with chemical reaction for improved, targeted filtration in water and air. This is a materials engineering process, not a climate accounting concept.
- Global Warming:
- Global warming is the long-term heating of Earth’s climate system observed since the pre-industrial period (between 1850 and 1900) due to human activities, primarily fossil fuel burning, which increases heat-trapping greenhouse gas levels in Earth’s atmosphere.
- Global Warming Potential (GWP):
- A measure of how much heat a greenhouse gas traps in the atmosphere compared to CO₂ over a specific time period (commonly 100 years).
- CO₂ has a GWP of 1.
- GWP is the scientific basis for converting gases into CO₂e.
- GWP was developed to allow comparisons of the global warming impacts of different gases.
- Greenhouse Gas (GHG):
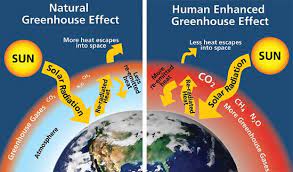
- Any gas that absorbs and traps infrared radiation in the atmosphere, contributing to the greenhouse effect.
- Main GHGs include:
- CO₂
- Methane (CH₄)
- Nitrous oxide (N₂O)
- Fluorinated gases
- Water vapor is a GHG but is not directly controlled by human emissions at scale.
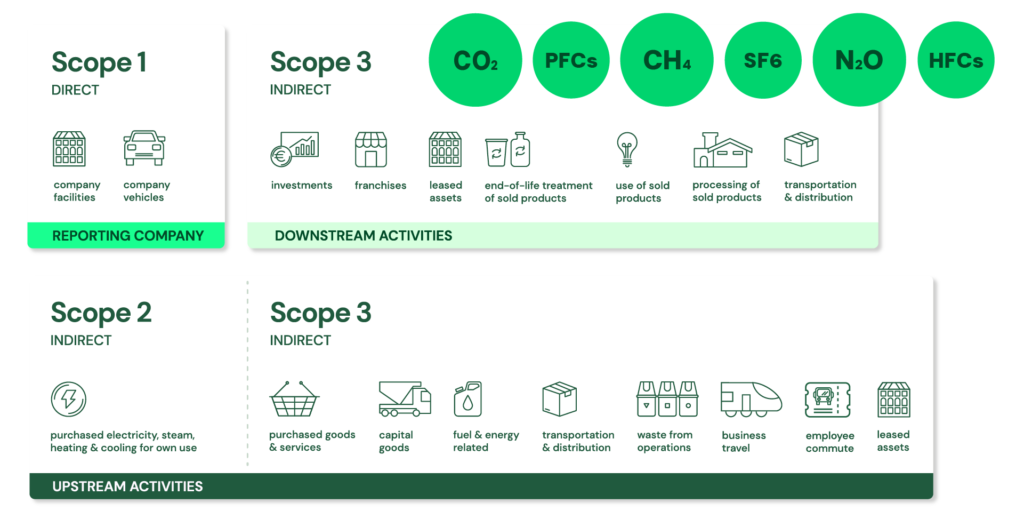
- GHG Protocol Corporate Standard Scope 1, 2 and 3: https://ghgprotocol.org/ + The GHG Protocol Corporate Accounting and Reporting Standard provides requirements and guidance for companies and other organizations preparing a corporate-level GHG emissions inventory. Scope 1 and 2 are typically mandatory for companies that are required to report their emissions by national or regional regulations. The GHG Protocol itself is a voluntary standard.
- Scope 1: Direct emissions:
- Direct emissions from company-owned and controlled resources. In other words, emissions are released into the atmosphere as a direct result of a set of activities, at a firm level. It is divided into four categories:
- Stationary combustion (e.g from fuels, heating sources). All fuels that produce GHG emissions must be included in scope 1.
- Mobile combustion is all vehicles owned or controlled by a firm, burning fuel (e.g. cars, vans, trucks). The increasing use of “electric” vehicles (EVs), means that some of the organisation’s fleets could fall into Scope 2 emissions.
- Fugitive emissions are leaks from greenhouse gases (e.g. refrigeration, air conditioning units). It is important to note that refrigerant gases are a thousand times more dangerous than CO2 emissions. Companies are encouraged to report these emissions.
- Process emissions are released during industrial processes, and on-site manufacturing (e.g. production of CO2 during cement manufacturing, factory fumes, chemicals).
- Direct emissions from company-owned and controlled resources. In other words, emissions are released into the atmosphere as a direct result of a set of activities, at a firm level. It is divided into four categories:
- Scope 2: Indirect emissions – owned:
- Indirect emissions from the generation of purchased energy, from a utility provider. In other words, all GHG emissions released in the atmosphere, from the consumption of purchased electricity, steam, heat and cooling. For most organisations, electricity will be the unique source of scope 2 emissions. Simply stated, the energy consumed falls into two scopes: Scope 2 covers the electricity consumed by the end-user. Scope 3 covers the energy used by the utilities during transmission and distribution (T&D losses).
- Scope 3: Indirect emissions – not owned:
- Indirect emissions – not included in scope 2 – that occur in the value chain of the reporting company, including both upstream and downstream emissions. In other words, emissions are linked to the company’s operations. According to the GHG protocol, scope 3 emissions are separated into 15 categories.
- Scope 1: Direct emissions:
- Fundamental Units of Electricity:
- Electric Current:
- Ampere – Amp (A):
- Amperes measure the flow of electrical current (electric charge) through a circuit. Ampere (A) is the SI unit of measure for the rate of electron flow, or current, in an electrical conductor.
- One ampere is defined as one coulomb of electric charge moving past a point in one second (1 A = 1 C/s). The ampere is named after the French physicist André-Marie Ampère, who made significant contributions to the study of electromagnetism.
- Milliampere (mA):
- Milliampere (mA) is a unit of electric current equal to one-thousandth of an ampere (1 mA = 0.001 A = 10⁻³ A). The prefix “milli” signifies 10⁻³ in the metric system. This unit is commonly used to measure small currents in electronic circuits and consumer devices.
- Ampere – Amp (A):
- Electrical Potential (Voltage):
- Volt (V):
- Volts measure the electric potential difference that drives the flow of electrons through a circuit. Voltage can be thought of as the “electrical pressure” that pushes current through a conductor.
- Kilovolt (kV):
- Kilovolt (kV) is a unit of potential difference equal to 1,000 volts (1 kV = 1,000 V).
- Volt (V):
- Electrical Power vs. Electrical Energy:
- Watts measure the rate of energy consumption or generation, also known as power.
- A useful analogy is:
- Power = the speed at which electricity is used or generated
- Energy = the total amount of electricity used or generated over time
- Power vs. Energy: how electricity is measured and billed.
- Power (measured in W, kW, MW, GW, TW): Rate at which energy is used or generated at a given moment.
- Energy (measured in Wh, kWh, MWh, GWh, TWh): Total amount of power consumed or generated over a period of time (Energy = Power × Time).
- Real Power Units:
- Real power units measure the actual (active) power that performs useful work.
- Kilowatt (kW):
- A kilowatt is simply a measure of how much power an electric appliance consumes—it’s 1,000 watts to be exact.
- You can quickly convert watts (W) to kilowatts (kW) by dividing your wattage by 1,000:
- 1,000 W = 1 kW
- Megawatt (MW):
- One megawatt equals one million watts or 1,000 kilowatts, roughly enough electricity for the instantaneous demand of approximately 500–1,000 homes (depending on region and consumption patterns).
- Gigawatt (GW):
- A gigawatt (GW) is a unit of power, and it is equal to one billion watts.
- According to the Department of Energy, generating one GW of power takes over three million solar panels or approximately 310 utility-scale wind turbines.
- Terawatt (TW):
- One terawatt is equal to one trillion watts (1,000,000,000,000 watts). The main use of terawatts is found in the electric power industry, particularly for measuring very large-scale power generation or consumption.
- According to the U.S. Energy Information Administration, America is one of the largest electricity consumers in the world, using about 4,146.2 terawatt-hours (TWh) of energy per year.
- Energy consumption should always be expressed in TWh (energy), not TW (power).
- Apparent Power Units:
- Apparent power measures the total electrical power supplied to an AC circuit, including both useful (real) power and non-working (reactive) power.
- Kilovolt-Amperes (kVA):
- Kilovolt-Amperes (kVA) stands for Kilo-volt-amperes, a term used for the rating of an electrical circuit. A kVA is a unit of apparent power, which is the product of the circuit’s voltage and current.
- The difference between real power (kW) and apparent power (kVA) is crucial.
- Real power (kW) is the actual power that performs work, while apparent power (kVA) is the total power delivered to a circuit, including the reactive power (measured in kVAR) that doesn’t perform useful work but is necessary to energize inductive equipment such as motors and transformers.
- The relationship between them is defined by the power factor.
- kW = kVA × Power Factor
- Since the power factor is typically less than 1, the kVA value will always be higher than the kW value.
- Megavolt-Amperes (MVA):
- Megavolt-Amperes (MVA) is a unit used to measure the apparent power in a circuit, primarily for very large electrical systems like power plants, substations, and transmission networks.
- 1 MVA is equivalent to:
- 1,000 kVA
- 1,000,000 VA
- Specialized Renewable Energy Unit:
- Kilowatt-peak (kWp):
- kWp stands for kilowatt-peak power output of a system. It is most commonly applied to solar photovoltaic (PV) systems.
- For example, a solar panel system with a peak power of 3 kWp working at its maximum capacity for one hour will produce up to 3 kWh.
- kWp (kilowatt peak) is the total kW rating of the system under Standard Test Conditions (STC).
- Example: If the system has four 270-watt panels: 4 × 0.27 kW = 1.08 kWp
- kWp does not universally correspond to 1,000 kWh/year; actual production depends strongly on location, irradiation, panel orientation, temperature, shading, and overall system efficiency (typically around 800–1,200 kWh/year per installed kWp in much of Europe).
- Kilowatt-peak (kWp):
- Electric Current: