
ams OSRAM – ams OSRAM delivers continued core growth despite mixed end-market demand, led by strong Opto Semiconductors


ams OSRAM delivers continued core growth despite mixed end-market demand, led by strong Opto Semiconductors
Core growth and underlying performance
- Led by reported growth of 9 % in Opto Semiconductors, semiconductor core portfolio grows approx. 3 % year-on-year on a like-for-like basis and at constant currencies
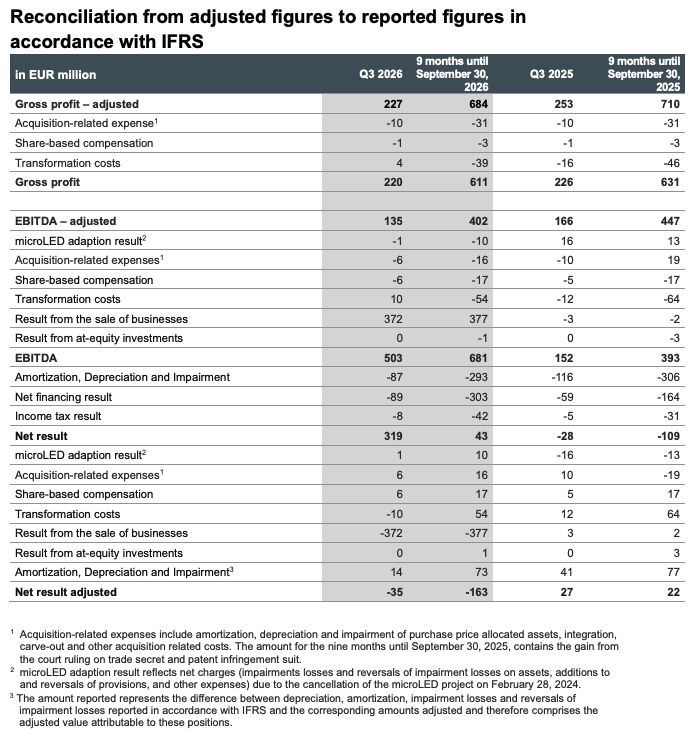
- Q3 revenues EUR 829 m reflect significant portfolio changes; adjusted EBITDA margin of 16.3 %, above the midpoint of the guidance; reported EBITDA margin of 60.7 % due to disposal gain of non-optical sensor business
- Approx. EUR 1.3 bn of semiconductor design wins in Q3, year-to-date approx. EUR 3.8 bn
Strategic growth vectors in Digital Photonics
- AI Photonics: 850nm Thin-Film microVCSELs for highly parallel, ultra-low-power optical interconnects as technology breakthrough shown, Credo-led OCP Short-Reach Micro-Emitter Optics standardization* (*Short-Reach Micro-Emitter Optics (SRMO) – Open Compute Project) effort and its micro-emitters part of Credo’s Active Light Cable demonstration.
Outlook
- Q4/26: revenues at EUR 750 m to 850 m, adj. EBITDA margin of 16.0 % ± 1.5 %
- FY27: path to positive Free Cash Flow confirmed
Premstaetten, Austria, and Munich, Germany (13 November 2026) – ams OSRAM delivered continued core growth in Q3 despite significant portfolio effects on reported results, while further progress in AI Photonics moves the technology closer to commercialization.
“We are increasingly seeing the strength of our reshaped core portfolio while turning our technology leadership in Digital Photonics into tangible commercial opportunities. AI Photonics, targeting datacenter optical interconnects, moves closer to commercialization. We are building the next growth chapter for ams OSRAM with a stronger portfolio, an improved financial profile and a clear focus on profitable growth with differentiating technology.” said Aldo Kamper, CEO of ams OSRAM.
Q3/26 – Group Financial Summary
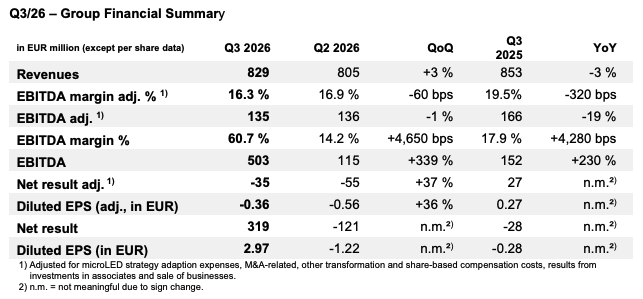
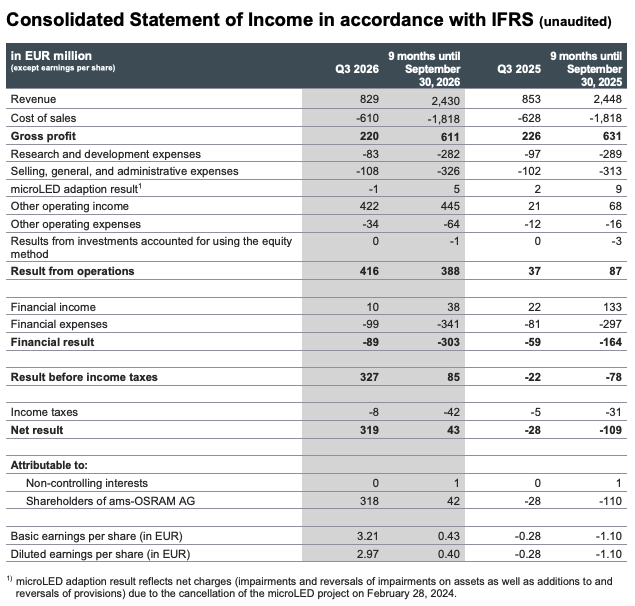
Group revenues reached EUR 829 million, up 3% sequentially, driven by continued growth in Opto Semiconductors and the seasonal upswing in the traditional automotive lamps business. Reported revenues declined 3% year-on-year, reflecting mainly significant portfolio changes. On a like-for-like basis and at constant currencies, the semiconductor core portfolio grew approximately 3% year-onyear led by 8% comparable growth in Opto Semiconductors, despite continued weakness in the Chinese smartphone market impacting Light Sensors & Photonics (LSP, formerly CMOS Sensors & ASICs).
Adjusted EBITDA was EUR 135 million, translating into an adjusted EBITDA margin of 16.3%, above the midpoint of guidance. The margin reflected the softer portfolio mix following the sale of the nonoptical sensor business and the related manufacturing services at non-accretive margins. Reported EBITDA of EUR 503 million and reported net result of EUR 319 million primarily reflected the income from selling the non-optical mixed-signal sensor business.
Q3/26 – Cash Generation & Financial Position
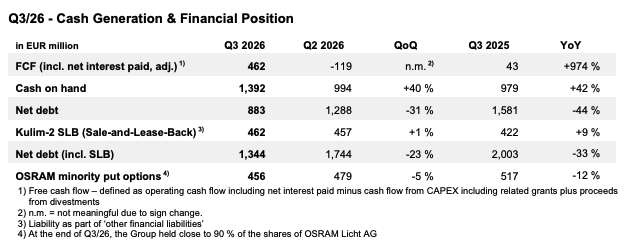
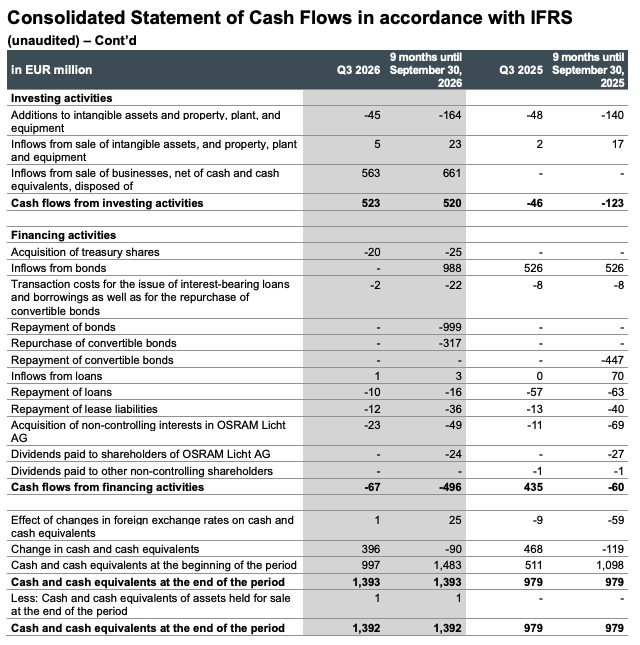
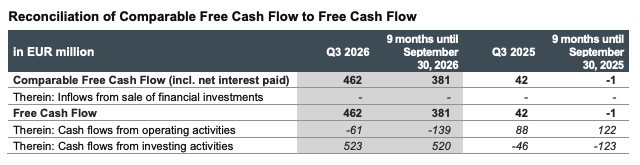
Free cash flow primarily reflected proceeds from the non-optical sensor divestment, significantly strengthening the Group’s financial position. Excluding divestment proceeds, cash generation was impacted by the further reduction of factoring and the semi-annual senior notes interest payment.
Execution of the Simplify program continued during the quarter, delivering more than EUR 20 million of run-rate savings to date towards the target of EUR 200 million by FY28.
Q3/26 – Digital Photonics: Commercialization Progress
AI Photonics: The Company advanced its 850 nm Thin-Film microVCSEL platform for highly parallel, ultra-low-power optical interconnects for next-generation AI infrastructure, demonstrating error-free 32 Gb/s operation at approximately 0.25 pJ/bit. At the same time, the ecosystem around the wide-and-slow architecture continues to expand, including ams OSRAM’s participation in the Credoled SRMO OCP initiative for interoperable short-reach micro-emitter optical links and micro-emitters featured in Credo’s Active Light Cable (ALC) demonstration.
Q3/26 – Business Unit (BU) Results & Industry Update
Semiconductor Business
Semiconductor revenues were EUR 625 million in Q3 2026, up 1% sequentially and down 2% year-on-year on a reported basis, with portfolio changes and softer consumer demand masking continued growth in the core business.
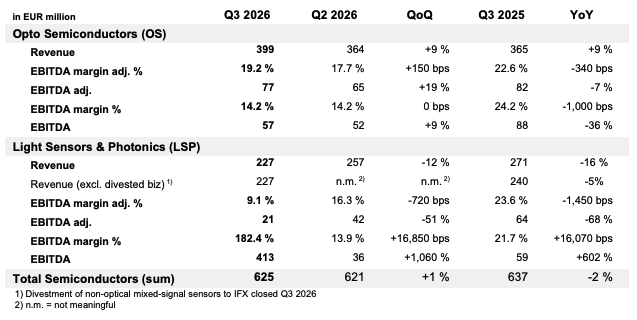
Optical Semiconductors (OS) delivered another strong quarter, with broad-based growth across end markets and adjusted EBITDA margin improving sequentially to 19.2% on higher volumes and better factory performance.
Light Sensors & Photonics (LSP) primarily reflected selling the non-optical sensor business to Infineon, softer consumer demand in China and the transition to manufacturing services.
Semiconductors industry dynamics
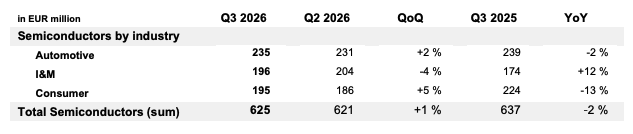
Automotive remained broadly stable year-on-year as continued content and market-share gains helped offset softer market conditions. Excluding portfolio effects, automotive semiconductor business grew by approx. 4 % year-on-year. Industrial & Medical grew 12% year-on-year, supported by the ongoing industrial recovery and strength in horticulture, visualization and sensing. Excluding portfolio effects, I&M grew by approx. 23% year-on-year. Consumer declined 13%, mainly reflecting weakness in the smartphone market and portfolio effects.
Lamps & Systems Business (L&S, traditional auto lamps):
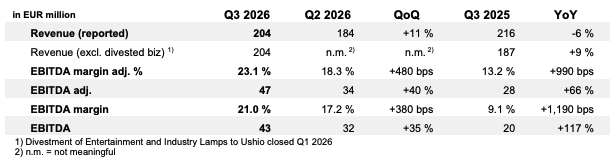
L&S showed also a portfolio effect: reported revenues declined 6% year-on-year as a result of the divestiture of the industrial- and entertainment business, while the remaining business grew 9%, continuing to demonstrate strong momentum and market-share gains amid structural shifts in the competitive landscape. Revenues increased 11% sequentially on normal seasonality, while the adjusted EBITDA margin expanded to 23.1% on higher volumes and improved factory performance.
Outlook
For Q4 2026, ams OSRAM expects revenues of EUR 750 – 850 million and an adjusted EBITDA margin of 16.0% ± 1.5 percentage points, based on an assumed EUR/USD exchange rate of 1.12. The outlook reflects normal seasonality, with lower semiconductor revenue expected to be partly offset by the seasonal peak in the traditional automotive lamps business. The impact of portfolio divestitures is of the order of EUR 75 million compared to Q4 2025.

For FY27, the company continues to see a clear path to positive free cash flow.
Additional Information
Additional financial information as well as a comprehensive investor presentation for the third quarter 2026 is available on the company website.
ams OSRAM will host a press call as well as a conference call for analysts and investors on the third quarter 2026 results on Friday, 13 November 2026. The conference call for analysts and investors will start at 9:45 a.m. CET and can be joined via webcast. The conference call for journalists will take place at 11:00 a.m. CET.
Ad hoc
Ad hoc announcement pursuant to Art. 53 Listing Rules of SIX Swiss Exchange
Consolidated Statement of Income in accordance with IFRS (unaudited)
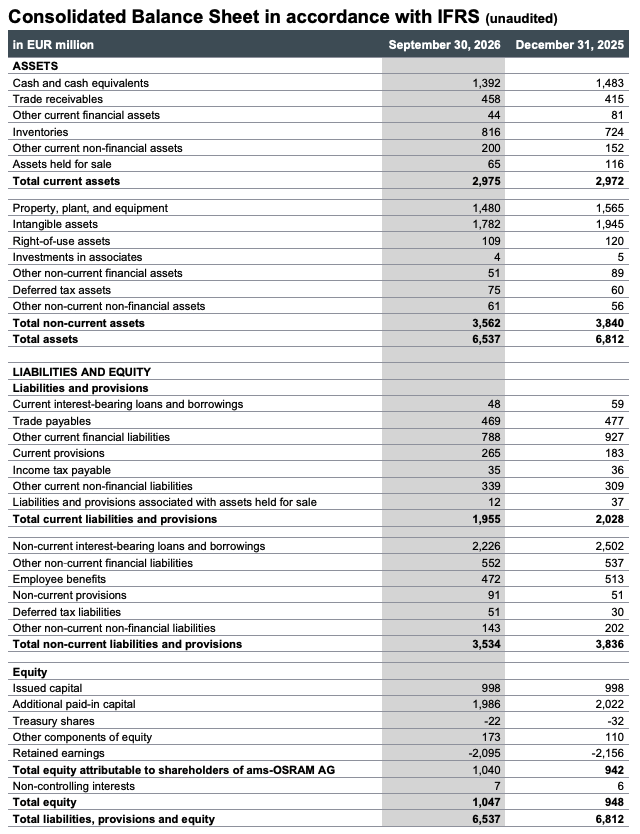
Consolidated Balance Sheet in accordance with IFRS (unaudited)
Consolidated Statement of Cash Flows in accordance with IFRS (unaudited)
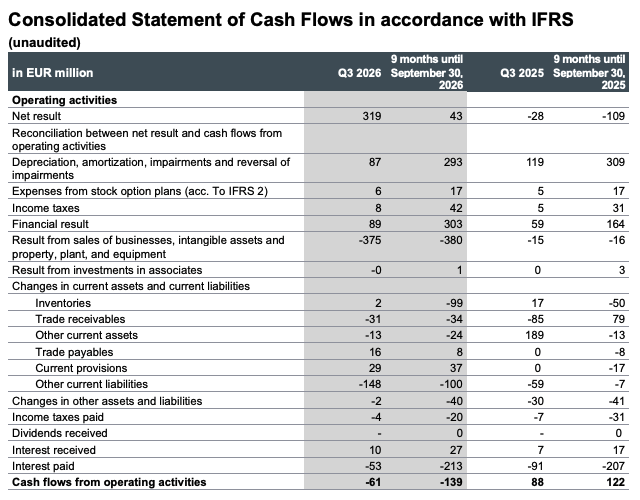
Consolidated Statement of Cash Flows in accordance with IFRS (unaudited) – Cont’d
Reconciliation from adjusted figures to reported figures in accordance with IFRS
Reconciliation of Comparable Free Cash Flow to Free Cash Flow
APM Definitions
EBIT
EBIT (Earnings Before Interest and Taxes) represents the result from operations based on the results reported in the Consolidated Statement of Income. This metric is derived from revenues and expenses recognized in the financial statements and includes all operating and other effects incurred during the reporting period. It serves as a key IFRS-based performance measure for assessing the company’s operating performance and represents the reference measure for the reconciliation to adjusted metrics.
EBIT Margin
EBIT Margin is calculated as EBIT divided by revenue for the respective period. This metric is used to analyze operating profitability after depreciation and amortization relative to revenue and enables a comparative assessment of margin development
EBIT adjusted
EBIT adjusted represents the result from operations adjusted for special items, particularly transformation effects, acquisition-related effects, and other non-operating or non-recurring items, including related depreciation and amortization effects. The adjustment items are disclosed separately. This metric is used to analyze operating performance after depreciation and amortization and provides a view of profitability excluding special items.
EBIT Margin adjusted
EBIT Margin adjusted is calculated as EBIT adjusted divided by revenue for the respective period. This metric is used to analyze operating profitability after depreciation and amortization relative to revenue and enables a comparative assessment of margin development excluding special items.
EBITDA
EBITDA (Earnings Before Interest, Taxes, Depreciation and Amortization) represents earnings before interest, taxes, depreciation of property, plant and equipment, and amortization of intangible assets, derived from the results reported in the Consolidated Statement of Income. The metric includes all effects recognized during the period without adjustments for special items. It is used to analyze operating earnings power before depreciation and amortization and serves as the reference measure for the reconciliation to adjusted metrics.
EBITDA Margin
EBITDA Margin is calculated as EBITDA divided by revenue for the respective period. This metric is used to analyze operating profitability before depreciation and amortization relative to revenue and enables a comparative assessment of margin development.
EBITDA adjusted
Adjusted EBITDA represents earnings before interest, taxes, depreciation of property, plant and equipment, and amortization of intangible assets, adjusted for special items, particularly transformation effects, acquisitionrelated effects, and other non-operating or non-recurring items. The adjustment items are disclosed separately. This metric is used to analyze operating performance before depreciation and amortization and provides a view of profitability excluding special items.
EBITDA Margin adjusted
EBITDA Margin adjusted is calculated as EBITDA adjusted divided by revenue for the respective period. This metric is used to analyze operating profitability before depreciation and amortization relative to revenue and enables a comparative assessment of margin development excluding special items
Net Result
Net Result represents the result after income tax based on the results reported in the Consolidated Statement of Income. The metric includes all effects recognized during the period without adjustments for special items. It is used to present earnings performance after tax and serves as the reference measure for the reconciliation to adjusted metrics.
Net Result adjusted
Net Result adjusted represents the result after income tax adjusted for special items at EBIT level as well as additional non-operating effects within financial income and income tax positions. The adjustment items are disclosed separately. This metric is used to present earnings performance after tax excluding special items and to enhance comparability.
Free Cash Flow
Free Cash Flow consists of cash flows from operating activities and cash flows from investing activities based on the Consolidated Statement of Cash Flows. The metric includes all cash flows incurred during the period without adjustments for special items. It is used to assess the actual generation of cash based on reported cash flows and serves as the reference measure for deriving Comparable Free Cash Flow.
Comparable Free Cash Flow
Comparable Free Cash Flow (incl. net interest paid) consists of cash flows from operating activities and cash flows from investing activities, less Inflows from sale of financial investments (e.g., cash inflows resulting from a change in pension trustee arrangements under IAS 19).
Net Debt
Net Debt represents current and non-current interest-bearing loans and borrowings less cash and cash equivalents, based on the balance sheet items reported in the Consolidated Balance Sheet. The scope of liabilities included (e.g., including or excluding lease liabilities) is disclosed separately. This metric is used to analyze the company’s indebtedness and capital structure.
Pro Forma Leverage Ratio
Pro Forma Leverage Ratio is calculated as Net Debt divided by EBITDA adjusted, taking into account transaction effects (e.g., divestitures) on a pro forma basis. This metric illustrates how leverage would appear after considering such changes and is used to assess the company’s financial position following significant portfolio measures or similar transactions.
Revenue Growth at Constant Currency
Revenue Growth at Constant Currency measures the change in revenue compared with the prior period after eliminating foreign exchange effects. This metric is used to analyze underlying operational revenue development independently of currency fluctuations.
Diluted Earnings per Share (EPS) adjusted
Diluted Earnings per Share adjusted is calculated as net result adjusted divided by the diluted weighted average number of shares outstanding. The adjustment items are disclosed separately. This metric is used to present adjusted earnings performance per share from the shareholders’ perspective, excluding special items.
Sourceams OSRAM
EMR Analysis
More information on OSRAM Light AG: See the full profile on EMR Executive Services
More information on ams OSRAM Group: See the full profile on EMR Executive Services
More information on Aldo Kamper (Chairman of the Management Board and Chief Executive Officer, ams OSRAM + Chief Executive Officer, OSRAM Licht AG + Interim General Manager, Opto Semiconductors Business Unit, ams OSRAM): See the full profile on EMR Executive Services
More information on Rainer Irle (Chief Financial Officer, ams OSRAM): See the full profile on EMR Executive Services
More information on “Re-establish the Base” Program by ams OSRAM Group: See the full profile on EMR Executive Services
EMR Additional Financial Notes:
- Major financial KPI’s since 2017 are available on EMR Executive Services under “Financial Results” and comparison with peers under “Market Positioning”
- Companies’ full profile on EMR Executive Services are based on their official press releases, quarterly financial reports, annual reports and other official documents.
- All members of the Executive Committee and of the Board have their full profile on EMR Executive Services
- ams OSRAM Third Quarter 2026 Earnings Release: https://ams-osram.com/documents/d/ams-osram/ad-hoc_2026_en-q3-2026-results
- ams OSRAM Third Quarter 2026 Earnings Investor Presentation: https://ams-osram.com/documents/d/ams-osram/investor-presentation-ams-osram-q3-2026
- ams OSRAM Third Quarter 2026 ESG Investor Presentation: https://ams-osram.com/documents/d/ams-osram/esg-ams-osram-2026
- ams OSRAM Second Quarter 2026 Earnings Release: https://ams-osram.com/documents/d/ams-osram/ad-hoc_2026_en-q2-2026-results
- ams OSRAM Second Quarter 2026 Earnings Investor Presentation: https://ams-osram.com/documents/d/ams-osram/investor-presentation-ams-osram-q2-2026
- ams OSRAM Second Quarter 2026 Results and Half-Year Report: https://ams-osram.com/documents/d/ams-osram/ams-osram-en-hy-report-2026
- ams OSRAM First Quarter 2026 Investor Presentation: https://ams-osram.com/documents/d/ams-osram/investor-presentation-ams-osram-q1-2026
- ams OSRAM First Quarter 2026 Earnings Presentation: https://ams-osram.com/documents/d/ams-osram/earnings-call-presentation-ams-osram-q1-2026
- ams OSRAM Annual Report 2025: https://ams-osram.com/documents/d/ams-osram/eng-geschafts-und-nachhaltigkeitsbericht-ams-osram-2025
- ams OSRAM Fourth Quarter 2025 Earning Release: https://ams-osram.com/documents/d/ams-osram/ad-hoc_2025_eng-q4-2025-results-1
- ams OSRAM Fourth Quarter 2025 Investor Presentation: https://ams-osram.com/documents/d/ams-osram/investor-presentation-ams-osram-q4-2025
- ams OSRAM Annual Report 2024: https://ams-osram.com/documents/d/ams-osram/annualreport2024
- ams OSRAM Full Year and Fourth Quarter 2024 Earning Release: https://ams-osram.com/documents/4390887/33910944/Ad-hoc_2025_eng%20Q4%202024%20results.pdf/9d32fa10-59eb-38b4-f441-e772566b8db0?t=1739207888157
- ams OSRAM Full Year and Fourth Quarter 2024 Investor Presentation: https://ams-osram.com/documents/4390887/33910944/Investor%20presentation%20ams%20OSRAM%20Q4%202024.pdf/446448a6-ac42-039a-1d5f-f44eeaad2a00?t=1739208105255
- ams OSRAM Annual Report 2023: https://ams-osram.com/documents/4390887/4391329/ams%20OSRAM%20EN%20Annual%20Report%202023.pdf/d73eb460-5fc0-093b-159f-d307d804aca1?t=1713257897189
- ams OSRAM Q4 2023 Financial Information: https://ams-osram.com/documents/4390887/18159172/Ad-hoc_2023_eng%20Q4%202023%20results%20f.pdf/c3225322-fece-1027-eee2-c68f2f5fa920?t=1707457179394
- ams OSRAM Q4 2023 and Fiscal Year 2023 Results Presentation: https://ams-osram.com/documents/4390887/18159172/Investor%20presentation%20ams%20OSRAM%20Q4%202023%20f.pdf/9dbb1b88-6228-5753-7dab-dec4c46fad72?t=1707457207957
- ams OSRAM Annual Report 2022: https://ams.com/documents/4390887/7195804/ams+OSRAM+ENG+Annual+Report+2022.pdf/41e30a76-ed35-2d2c-7933-6f1512453b17?t=1682601137245
- ams OSRAM Annual Report 2021: https://ams-osram.com/documents/4390887/7186639/ams+OSRAM+ENG+Annual+Report+2021.pdf/bd499ed8-8ad9-ffe9-ea5a-00a4d3d080f2?t=1651243968659