Signify – Signify’s third quarter results 2025


Signify reports third quarter sales of EUR 1.4 billion, operational profitability of 9.7% and a free cash flow of EUR 71 million
Third quarter 20251
- Signify’s installed base of connected light points increased to 160 million in Q3 25
- On track for three Brighter Lives, Better World 2025 sustainability program commitments
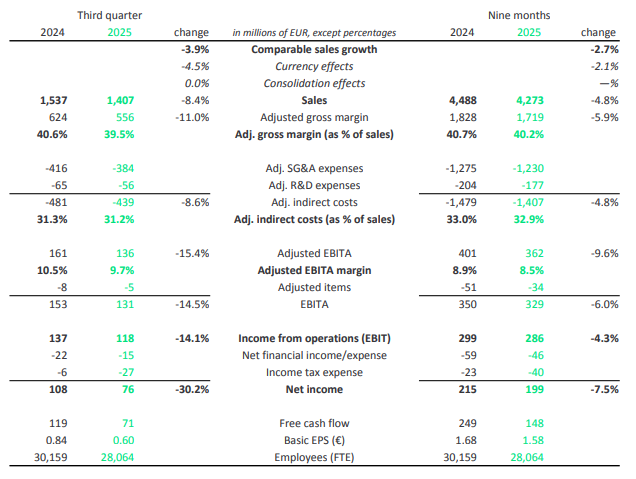
- Sales of EUR 1,407 million; nominal sales of -8.4%
- Comparable Sales Growth (CSG) of -3.9%; -2.7% excluding the Conventional business
- Adj. EBITA margin of 9.7% (Q3 24: 10.5%)
- Net income of EUR 76 million (Q3 24: EUR 108 million)
- Free cash flow of EUR 71 million (Q3 24: EUR 119 million)
- Share repurchase program on track; EUR 116.4 million of shares repurchased until September 30, 2025
1 This press release contains certain non-IFRS financial measures and rations, which are not recognized measures of financial performance or liquidity under IFRS. For further details, refer to “Non-IFRS Financial Measures” in “Important information” of this press release.
Eindhoven, the Netherlands – Signify (Euronext: LIGHT), the world leader in lighting, today announced the company’s third quarter 2025 results.
As Tempelman, CEO of Signify, comments:
“The market conditions today are challenging, with subdued demand and price pressure in Europe, and a slower than expected US market. While the trade channel and public sector were soft, our strategy to outperform in connected lighting and specialty offerings is delivering sustained growth.
The Consumer business continues to grow, boosted by our strong brand and the successful expansion of the Hue portfolio. In Professional, we continued to perform well in the project business, connected and specialty lighting such as agricultural lighting. The Professional and Consumer businesses both delivered robust margins.
Our OEM business has faced reduced demand and price pressure, as well as the anticipated impact of two major customers. The Conventional business declined as anticipated, with an additional impact from a manufacturing site rationalization.
Based on a softer than expected US market and further demand compression in the OEM business, we expect a comparable sales growth of -2.5 to -3.0%, or -1.0 to -1.5% excluding Conventional, an adjusted EBITA margin of 9.1-9.6%, and free cash flow generation around 7% of sales.
Looking ahead, we will focus on commercial and supply chain excellence, continuing to invest and leverage the full potential of our digital and AI capabilities, while maintaining our established cost and capital discipline. We are planning a Capital Markets Day next year where we will provide clarity on our portfolio, growth strategy and capital allocation.
I am impressed by the passion of our people and the strong culture of innovation. We will build on this and continue the shift in our culture to deliver the full potential of our operating model, with empowered and accountable market-led teams, focused R&D, accelerated digitalization and AI adoption, both in our customer offerings and in how we operate.”
Brighter Lives, Better World 2025
In the third quarter of the year, Signify continued to progress on its Brighter Lives, Better World 2025 sustainability program commitments that contribute to doubling its positive impact on environment and society.
Reduce greenhouse gas emissions
Signify is ahead of schedule to achieve its 2025 target to reduce greenhouse gas (GHG) emissions across its entire value chain by 40% against the 2019 baseline – double the pace required by the Paris Agreement.
Circular revenues
Circular revenues increased to 37% this quarter and beyond the 2025 target of 32%. The main contribution was from serviceable luminaires in the Professional business in all regions.
Brighter lives revenues
Brighter lives revenues increased to 34%, up 1% over last quarter, ahead of the 2025 target of 32%. This includes a strong contribution from Professional and Consumer products that support food availability and health and well-being.
Percentage of women in leadership
The percentage of women in leadership positions remained at 27% this quarter, which is not aligned with our 2025 ambitions. Signify continues its actions to increase representation through focused hiring practices for diversity across all levels, and through retention and engagement actions to reduce attrition.
Outlook
Based on a softer than expected US market and further demand compression in the OEM business, Signify is adapting its guidance for FY 2025 as follows:
- Comparable sales growth of -2.5 to -3.0%, or -1.0 to -1.5% excluding Conventional, from previously low single digit growth excluding Conventional
- Adj. EBITA margin of 9.1-9.6%, from previously 9.6-9.9%
- Free cash flow as a percentage of sales of around 7%, from previously 7-8% of sales
Financial review
Third quarter
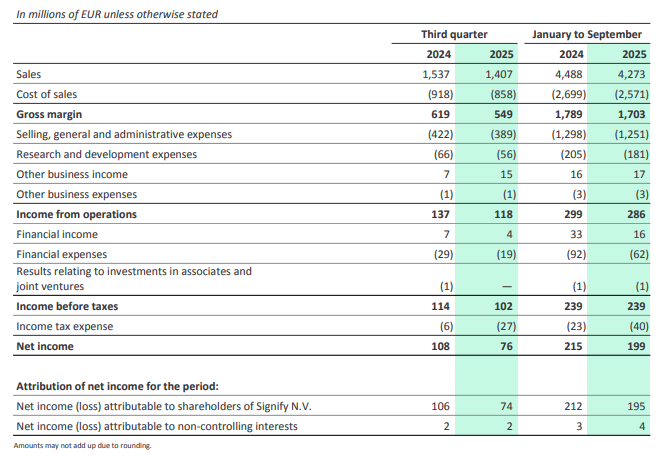
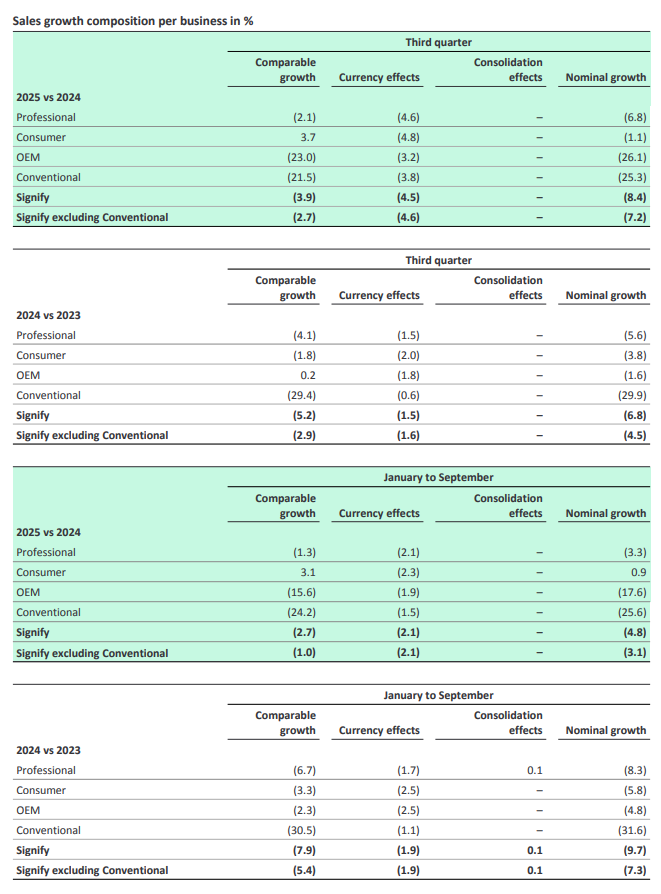
Nominal sales decreased by 8.4% to EUR 1,407 million, including a negative currency effect of 4.5%, mainly related to the depreciation of the US dollar. Comparable sales growth was -3.9%. Excluding the Conventional business, the comparable sales growth was -2.7%, reflecting the continued weakness in Europe’s Professional and OEM businesses as well as a lower contribution from the US.
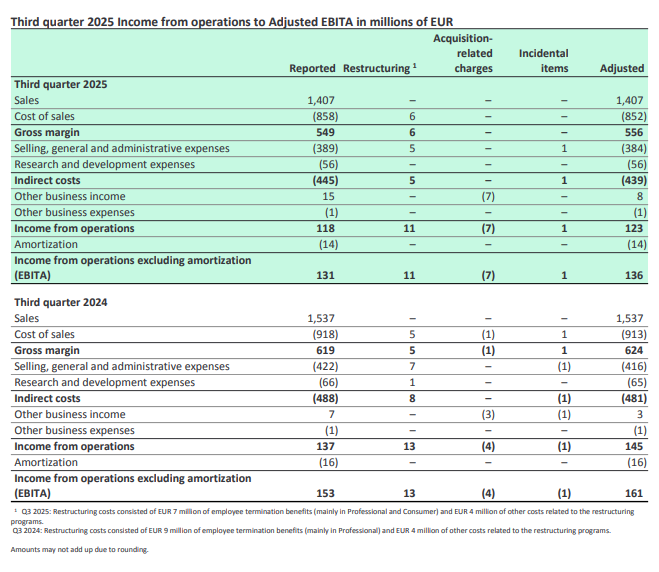
The Adjusted gross margin decreased by 110 bps to 39.5%, largely attributable to the temporarily higher manufacturing costs in the Conventional business and the competitive environment of the OEM business. Adjusted indirect costs improved slightly to 31.2%, as fixed cost reductions were largely offset by the effect of lower volumes.
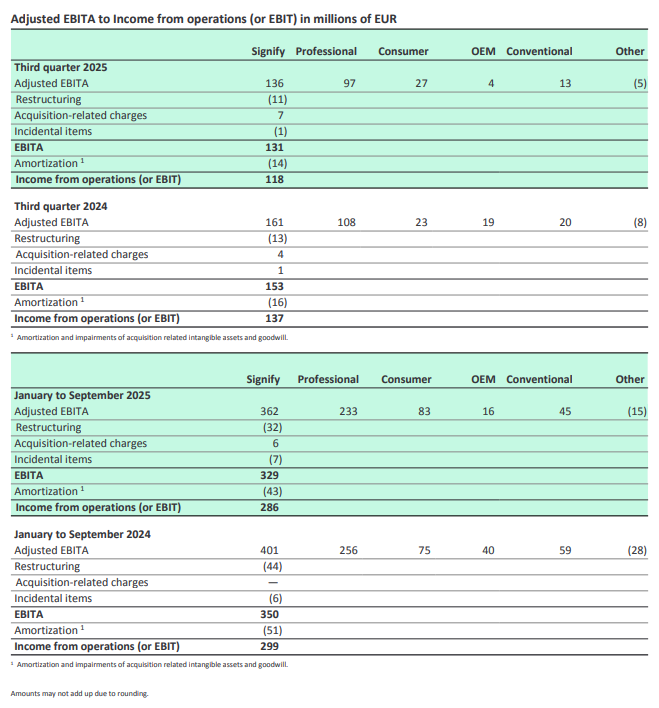
Adjusted EBITA was EUR 136 million. The Adjusted EBITA margin decreased by 80 bps to 9.7%, as lower volumes and gross margin were partly compensated by indirect cost savings.
Adjusted items were EUR -5 million, as restructuring costs of EUR -11 million were partly compensated by gains related to balances of prior acquisitions.
Net income decreased to EUR 76 million, reflecting a lower income from operations as well as a higher income tax expense, as the previous year included a one-off tax benefit.
The number of employees (FTE) decreased from 30,159 at the end of Q3 24 to 28,064 at the end of Q3 25. The year-on-year decrease is mostly related to the 2023 reorganization program and a reduction of factory personnel due to lower production volumes. In general, the number of FTEs is affected by fluctuations in volume and seasonality.
Professional
Third quarter
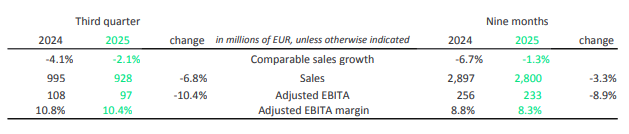
Nominal sales decreased by 6.8% to EUR 928 million, including a negative currency effect of 4.6% mainly related to the depreciation of the US dollar. Comparable sales growth was -2.1% (Q3 24: -4.1%), reflecting the continued softness in Europe and a stronger than expected slowdown in the US, particularly in the trade channel, which were partly offset by a strong agricultural lighting performance. The Adjusted EBITA margin decreased by 40 bps to 10.4%, mostly due to an under-absorption of fixed costs.
Consumer
Third quarter
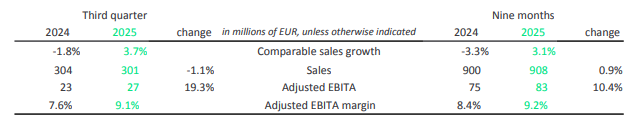
Nominal sales decreased by 1.1% to EUR 301 million, including a negative currency effect of 4.8%, mainly related to the depreciation of the US dollar. Comparable sales grew by 3.7% (Q3 24: -1.8%), reflecting a continued strong performance of Signify’s connected home brands across most geographies, driven by successful launches of new products and further accelerating online sales, as well as a strong performance in India. The Adjusted EBITA margin improved by 150 bps to 9.1%, reflecting a robust gross margin and operating leverage.
OEM
Third quarter
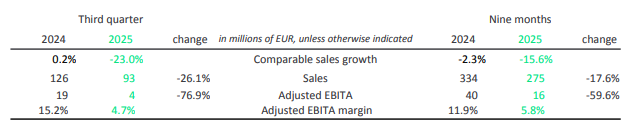
Nominal sales decreased by 26.1% to EUR 93 million, including a negative currency effect of 3.2% mainly related to the depreciation of the US dollar. Comparable sales decreased by 23% (Q3 24: 0.2%), driven by the continued effect of lower orders from two major customers and intense price pressure and a further weakening of demand. The Adjusted EBITA margin decreased to 4.7% reflecting the volume reduction and gross margin pressure.
Conventional
Third quarter
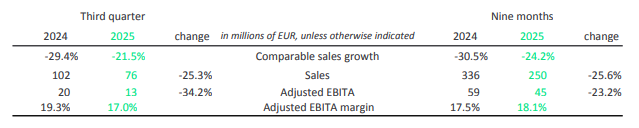
Nominal sales decreased by 25.3% to EUR 76 million, including a negative currency effect of 3.8% mainly related to the depreciation of the US dollar. Comparable sales decreased by 21.5% (Q3 24: -29.4%), reflecting the structural decline of the business. The Adjusted EBITA margin decreased by 230 bps to 17.0% mainly due to temporarily higher manufacturing costs due to site rationalization, which are expected to persist for the next two-three quarters.
Other
Third quarter
‘Other’ reflects the P&L of Signify’s venture businesses, in addition to centrally incurred costs not assigned to individual businesses, predominantly those related to exploratory research initiatives and audit activities.
Nominal sales were EUR 9 million (Q3 2024: EUR 10 million) and adjusted EBITA was EUR -5 million (Q3 24: EUR -8 million).
Working capital
Third quarter
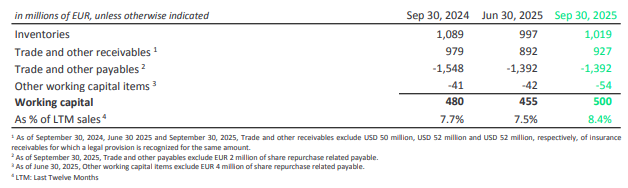
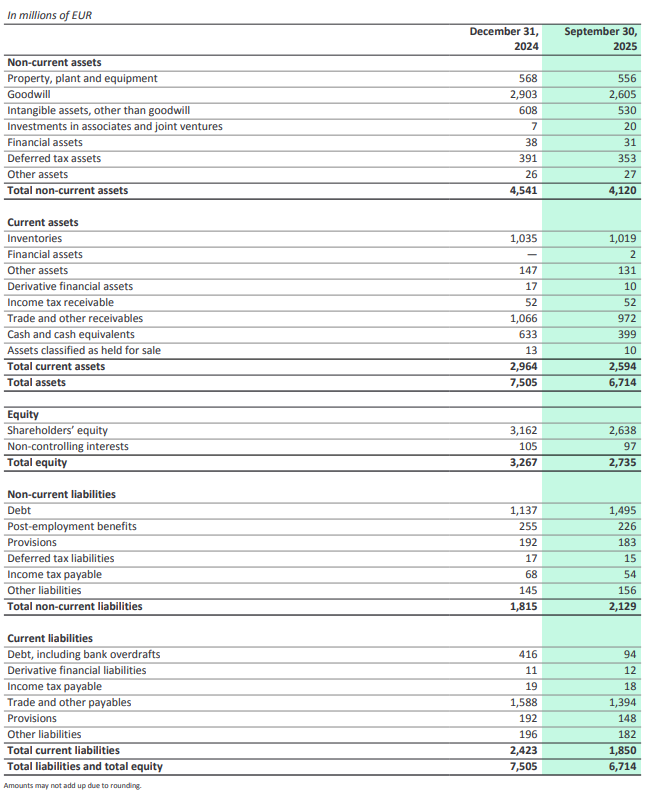
Compared to June 2025, working capital increased to EUR 500 million, due to higher inventories and receivables, while payables remained stable. As a percentage of last 12 months’ sales, working capital increased by 90 bps to 8.4%.
Compared to September 2024, working capital increased by EUR 20 million, as a reduction of inventories and receivables was more than offset by lower payables. As a percentage of last 12 months’ sales, working capital increased by 70 bps.
Cash flow analysis
Third quarter
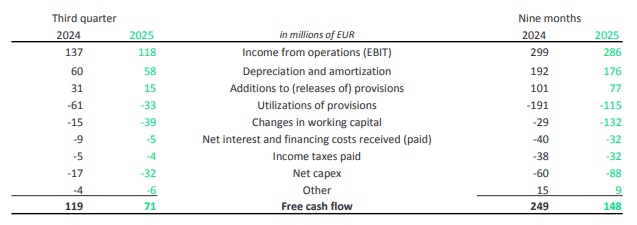
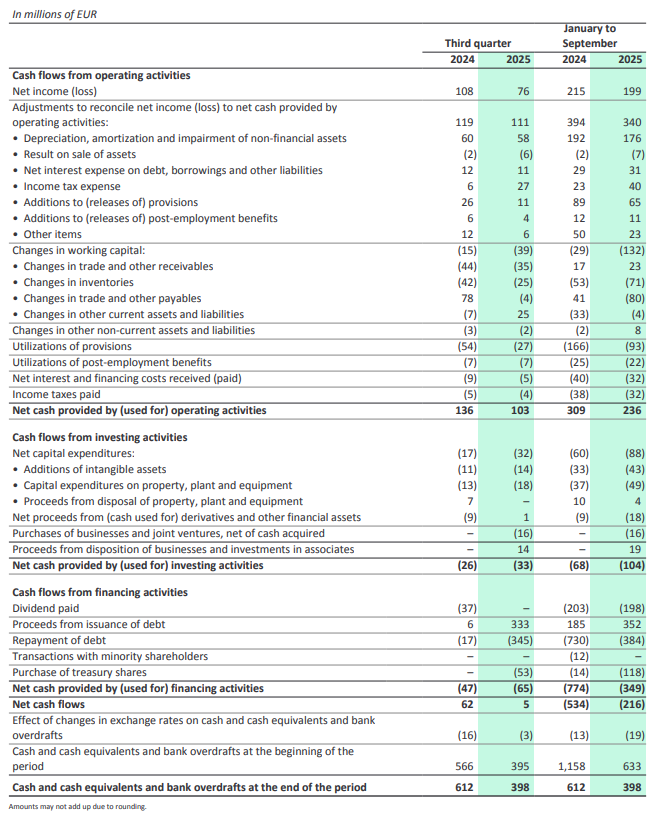
Free cash flow decreased to EUR 71 million, mainly due to lower income from operations and a higher cash outflow from working capital and capex, partly offset by a lower payout related to restructuring. In Q3 25, free cash flow included a restructuring payout of EUR 11 million (Q3 24: EUR 32 million).
Net debt and total equity
Third quarter
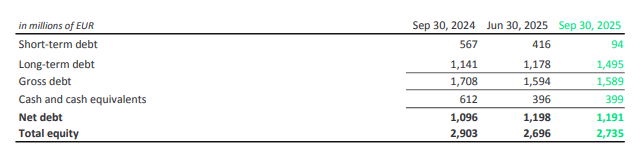
Compared to the end of June 2025, the cash position increased by EUR 3 million to EUR 399 million, mainly driven by free cash flow generation offset by the continuing share repurchase program. During the quarter, EUR 325 million short-term debt was repaid and replaced with new three-year long-term debt of EUR 325 million. Gross debt slightly decreased to EUR 1,589 million and net debt reduced to EUR 1,191 million. Total equity increased to EUR 2,735 million (Q2 25: EUR 2,696 million), primarily due to net income offset by share repurchases.
Compared to the end of September 2024, the cash position decreased by EUR 213 million primarily due to net repayment of debt, dividend payment and share repurchase program, partly offset by free cash flow generation. Gross debt reduced by EUR 119 million. Net debt increased by EUR 95 million year on year. At the end of September 2025, the net debt/EBITDA ratio was 1.7x down from 1.8x in Q3 2024.
In October 2025, Signify signed a new revolving credit facility of EUR 600 million with a five-year maturity plus two one-year extension options to replace its EUR 500 million revolving credit facility which was due to expire in January 2027. The new Revolving Credit Facility has similar terms compared to the previous facility.
Other information
- Appendix A – Selection of financial statements
- Appendix B – Reconciliation of non-IFRS financial measures
- Appendix C – Financial Glossary
Conference call and audio webcast
As Tempelman (CEO) and Željko Kosanović (CFO) will host a conference call for analysts and institutional investors at 9:00 a.m. CET to discuss the third quarter 2025 results. A live audio webcast of the conference call will be available via the Investor Relations website.
Financial calendar 2026
- January 30, 2026 Fourth quarter and full-year results 2025
- February 24, 2026 Annual Report 2025
Important information
Forward-Looking Statements and Risks & Uncertainties
This document and the related oral presentation contain, and responses to questions following the presentation may contain, forward-looking statements that reflect the intentions, beliefs or current expectations and projections of Signify N.V. (the “Company”, and together with its subsidiaries, the “Group”), including statements regarding strategy, estimates of sales growth and future operational results.
By their nature, these statements involve risks and uncertainties facing the Company and its Group companies, and a number of important factors could cause actual results or outcomes to differ materially from those expressed in any forward-looking statement as a result of risks and uncertainties. Such risks, uncertainties and other important factors include but are not limited to: adverse economic and geopolitical developments including the potential impact of trade tariffs, the impact of the increasing conflicts globally, volatility in interest rates, inflation and currency fluctuations, changes in international tax laws, economic downturns in key geographies to the company, supply chain disruptions, new technological disruptions, cybersecurity risk, competition in the general lighting market, reputational and adverse effects on business due to activities in Environment, Health & Safety, compliance risk, ability to attract and retain talented personnel, pension liabilities.
Additional risks currently not known to the Group or that the Group has not considered material as of the date of this document could also prove to be important and may have a material adverse effect on the business, results of operations, financial condition and prospects of the Group or could cause the forward-looking events discussed in this document not to occur. The Group undertakes no duty to and will not necessarily update any of the forward-looking statements in light of new information or future events, except to the extent required by applicable law.
Market and Industry Information
All references to market share, market data, industry statistics and industry forecasts in this document consist of estimates compiled by industry professionals, competitors, organizations or analysts, of publicly available information or of the Group’s own assessment of its sales and markets. Rankings are based on sales unless otherwise stated.
Non-IFRS Financial Measures
Certain parts of this document contain non-IFRS financial measures and ratios, such as comparable sales growth, adjusted gross margin and indirect costs, EBITA, adjusted EBITA, free cash flow, Net debt, Working capital, Brighter lives revenues, Circular revenues and other related ratios, which are not recognized measures of financial performance or liquidity under IFRS. The non-IFRS financial measures presented are measures used by management to monitor the underlying performance of the Group’s business and operations. Not all companies calculate non-IFRS financial measures in the same manner or on a consistent basis and these measures and ratios may not be comparable to measures used by other companies under the same or similar names. A reconciliation of a number of non-IFRS financial measures to the most directly comparable IFRS financial measures is contained in appendix B, Reconciliation of non-IFRS financial measures, of this document. For further information on non-IFRS financial measures, see “Chapter 18 Reconciliation of non-IFRS measures” in the Annual Report 2024.
Presentation
All amounts are in millions of euros unless otherwise stated. Due to rounding, amounts may not add up to totals provided. All reported data is unaudited. Unless otherwise indicated, financial information has been prepared in accordance with the accounting policies as stated in the Annual Report 2024 and the Semi-Annual Report 2025.
Market Abuse Regulation
This press release contains information within the meaning of Article 7(1) of the EU Market Abuse Regulation.
Appendix A – Financial statement information
A. Condensed consolidated statement of income
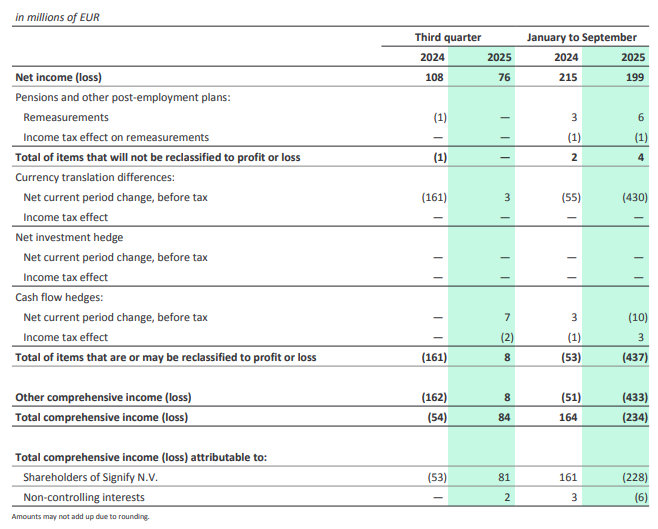
B. Condensed consolidated statement of comprehensive income
C. Condensed consolidated statement of financial position
D. Condensed consolidated statement of cash flows
Appendix B – Reconciliation of non-IFRS financial measures
Appendix C – Financial glossary
- Acquisition-related charges
- Costs that are directly triggered by the acquisition of a company, such as transaction costs, purchase accounting related costs and integration-related expenses.
- Adjusted EBITA
- EBITA excluding restructuring costs, acquisitionrelated charges, and other incidental items.
- Adjusted EBITA margin
- Adjusted EBITA divided by sales to third parties (excluding intersegment). “Operational profitability” also refers to this metric.
- Adjusted gross margin
- Gross margin, excluding restructuring costs, acquisition-related charges, and other incidental items attributable to cost of sales.
- Adjusted indirect costs
- Indirect costs, excluding restructuring costs, acquisition-related charges, and other incidental items attributable to indirect costs.
- Adjusted R&D expenses
- Research and development expenses, excluding restructuring costs, acquisition-related charges, and other incidental items attributable to research and development expenses.
- Adjusted SG&A expenses
- Selling, general and administrative expenses, excluding restructuring costs, acquisition-related charges, and other incidental items attributable to selling, general and administrative expenses.
- Brighter lives revenues
- Percentage of total revenues coming from all products, systems and services contributing to Food availability, Safety & security, or Health & well-being.
- Circular revenues
- Revenues measured as a percentage of total revenues coming from products, systems and services designed to preserve value and avoid waste categorized as Serviceable luminaires (incl. 3D printing), Circular components, Intelligent systems or Circular services.
- Comparable sales growth (CSG)
- The period-on-period growth in sales excluding the effects of currency movements and changes in consolidation.
- Consolidation effects
- In the event a business is acquired (or divested), the impact of the consolidation (or deconsolidation) on the Group’s figures is included (or excluded) in the calculation of the comparable sales growth figures.
- Currency effects
- Calculated by translating the foreign currency financials of the previous period and the current period into euros at the same average exchange rates.
- EBIT
- Income from operations.
- EBITA
- Income from operations excluding amortization and impairment of acquisition-related intangible assets and goodwill.
- EBITDA
- Income from operations excluding depreciation, amortization, and impairment of non-financial assets.
- Employees
- Employees of Signify at the end of the period, expressed on a full-time equivalent (FTE) basis.
- Free cash flow
- Net cash provided by operating activities minus net capital expenditures. Free cash flow includes interest paid and income taxes paid.
- Gross margin
- Sales minus cost of sales.
- Incidental items
- Any item with an income statement impact (loss or gain) that is deemed to be both significant and not part of normal business activity. Other incidental items may extend over several quarters within the same financial year.
- Indirect costs
- The sum of selling, general and administrative expenses and R&D expenses.
- Net capital expenditures
- Additions of intangible assets, capital expenditures on property, plant and equipment and proceeds from disposal of property, plant and equipment.
- Net debt
- Short-term debt, long-term debt minus cash and cash equivalents.
- Net leverage ratio
- The ratio of consolidated reported net debt to consolidated reported EBITDA for the purpose of calculating the financial covenant.
- R&D expenses
- Research and development expenses.
- Restructuring costs
- The estimated costs of initiated reorganizations which have been approved by the company, and generally involve the realignment of certain parts of the organization. Restructuring costs include costs for employee termination benefits for affected employees and other costs directly attributable to the restructuring, such as impairment of assets and inventories.
- SG&A expenses
- Selling, general and administrative expenses.
- Working capital
- The sum of inventories, trade and other receivables (excluding insurance receivables for which a legal provision is recognized for the same amount), other current assets, derivative financial assets minus the sum of trade and other payables, derivative financial liabilities and other current liabilities (excluding dividend and share repurchases related payables).
SourceSignify
EMR Analysis
More information on Signify: See the full profile on EMR Executive Services
More information on As Tempelman (Member of the Board + Chief Executive Officer, Signify): See the full profile on EMR Executive Services
More information on Željko Kosanović (Member of the Board + Chief Financial Officer + Senior Vice President, Group Controller, Signify): See the full profile on EMR Executive Services
More information on the Sustainability Program (Brighter Lives, Better World 2025) + The Climate Transition Plan 2040 by Signify: See the full profile on EMR Executive Services
More information on Maurice Loosschilder (Head of Sustainability, Signify): See the full profile on EMR Executive Services
More information on Philips Lighting by Signify https://www.lighting.philips.com/main/home + Philips is one of the world’s most trusted lighting brands. Since 1891, Philips has been synonymous with high-quality, reliable, innovative technology that improve people’s lives. The Philips brand is licensed to Signify, world leader in lighting, for lighting products and services. Philips is Signify’s primary brand for lamps, luminaires, and other lighting products for both professionals and consumers.
Signify products carrying the Philips brand cover the complete range of lighting applications, from home, office, and industry to street lighting, horticulture, sports, and more.
More information on Philips Hue by Philips Lighting by Signify: https://www.philips-hue.com/en-us + Philips Hue is the world leader in smart lighting. With its range of smart LED bulbs, light fixtures, lamps, sensors, and smart switches, Philips Hue brings smart lighting to everyday homes. The smart lighting system lets you set the mood with beautiful colors and Scenes, set up convenient timers and automations to help you feel safer in your surroundings, use the best light for your daily activities, and help make your life that much easier.
More information on Jasper Vervoort (General Manager, Philips Hue, Signify): See the full profile on EMR Executive Services
EMR Additional Financial Notes:
- Major financial KPI’s since 2017 are available on EMR Executive Services under “Financial Results” and comparison with peers under “Market Positioning”
- Companies’ full profile on EMR Executive Services are based on their official press releases, quarterly financial reports, annual reports and other official documents.
- All members of the Executive Committee and of the Board have their full profile on EMR Executive Services
- The Signify Q3 2025 Results Report can be found here: https://www.signify.com/static/quarterlyresults/2025/q3_2025/signify-third-quarter-results-2025-report.pdf
- The Signify Q3 2025 Results Presentation can be found here: https://www.signify.com/static/quarterlyresults/2025/q3_2025/signify-third-quarter-results-2025-presentation.pdf
- The Signify Q2 2025 Results Report can be found here: https://www.signify.com/static/quarterlyresults/2025/q2_2025/signify-second-quarter-results-2025-report.pdf
- The Signify Q2 2025 Results Presentation can be found here: https://www.signify.com/static/quarterlyresults/2025/q2_2025/signify-second-quarter-results-2025-presentation.pdf
- The Signify Annual Report 2024 can be found here: https://www.signify.com/static/2024/signify-annual-report-2024.pdf
- The Signify Q4 and Full Year 2024 Results Report can be found here: https://www.signify.com/static/quarterlyresults/2024/q4_2024/signify-fourth-quarter-and-full-year-results-2024-report.pdf
- The Signify Q4 and Full Year 2024 Results Presentation can be found here: https://www.signify.com/static/quarterlyresults/2024/q4_2024/signify-fourth-quarter-and-full-year-results-2024-presentation.pdf
- The Signify comparable financials for 2023 and Q1 2024 following implementation of new organizational structure can be found here: https://www.assets.signify.com/is/content/Signify/Assets/signify/global/news/2024/20240614-signify-publishes-comparable-financials-for-2023-and-q1-2024.pdf
- The Signify Annual Report 2023 can be found here: https://www.signify.com/static/2022/signify-annual-report-2022.pdf
- The Signify Q4 and full-year results 2023 Report can be found here: https://www.signify.com/static/quarterlyresults/2023/q4_2023/signify-fourth-quarter-and-full-year-results-2023-report.pdf
- The Signify Q4 and full-year results 2023 Presentation can be found here: https://www.signify.com/static/quarterlyresults/2023/q4_2023/signify-fourth-quarter-and-full-year-results-2023-presentation.pdf
- The Signify Annual Report 2022 can be found here: https://www.signify.com/static/2022/signify-annual-report-2022.pdf
- The Signify Q4 2022 Presentation can be found here: https://www.signify.com/static/quarterlyresults/2022/q4_2022/signify-fourth-quarter-and-full-year-results-2022-presentation.pdf
- The Signify Business Highlights 2022 Video can be found here: https://www.signify.com/global/our-company/news/press-releases/2023/20230127-signify-fourth-quarter-and-full-year-results-2022