Signify – Signify reports full-year 2025 sales of EUR 5.8 billion, operational profitability of 8.9% and a free cash flow of EUR 440 million


Highlights 1
- Signify’s installed base of connected light points increased to 167 million at the end of 2025
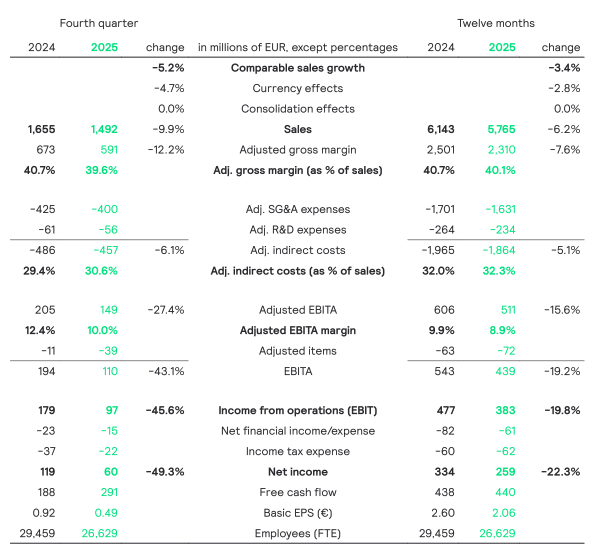
- FY 25 sales of EUR 5,765 million with a CSG of -3.4%; Q4 25 sales of EUR 1,492 million with a CSG of -5.2%
- Adj. EBITA margin of 8.9% in FY 25 (FY 24: 9.9%) and 10% in Q4 25 (Q4 24: 12.4%)
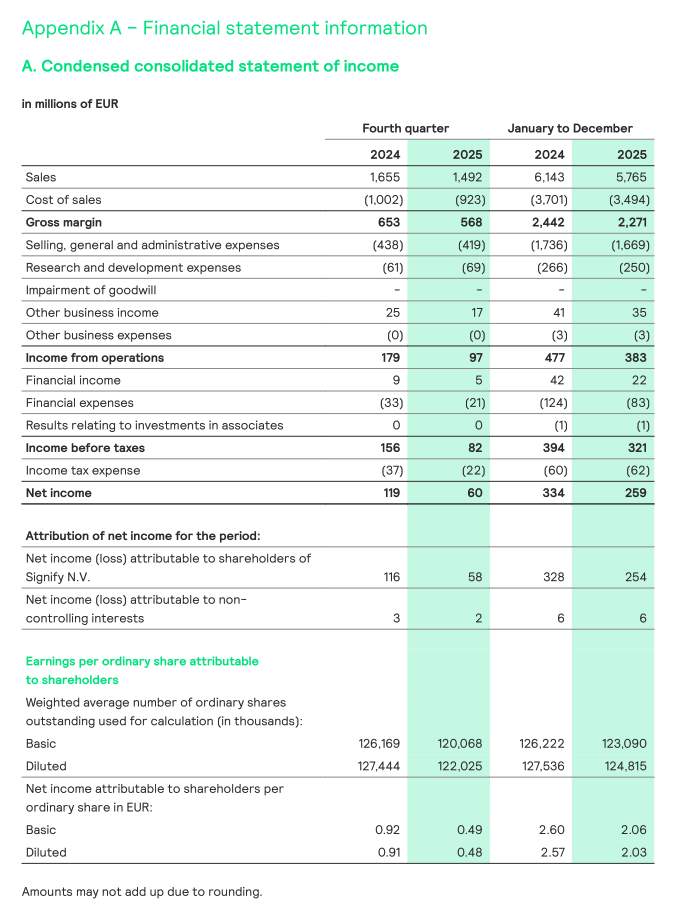
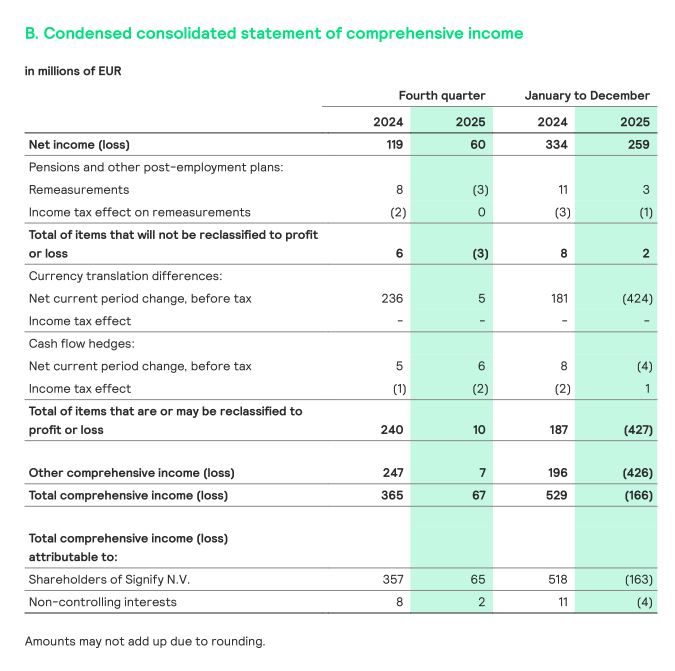
- Net income of EUR 259 million (FY 24: EUR 334 million) and EUR 60 million in Q4 25 (Q4 24: 119 million)
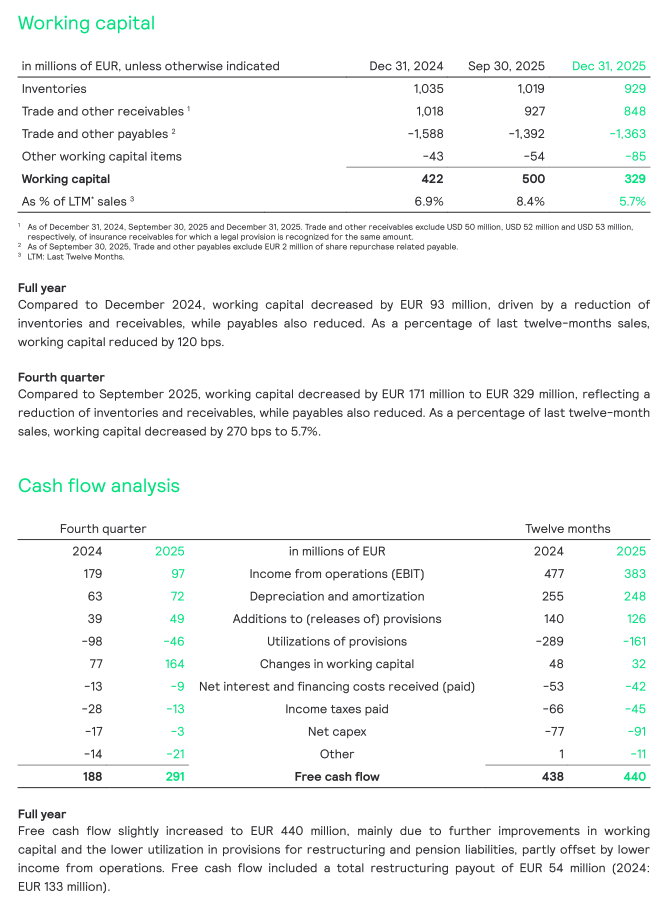
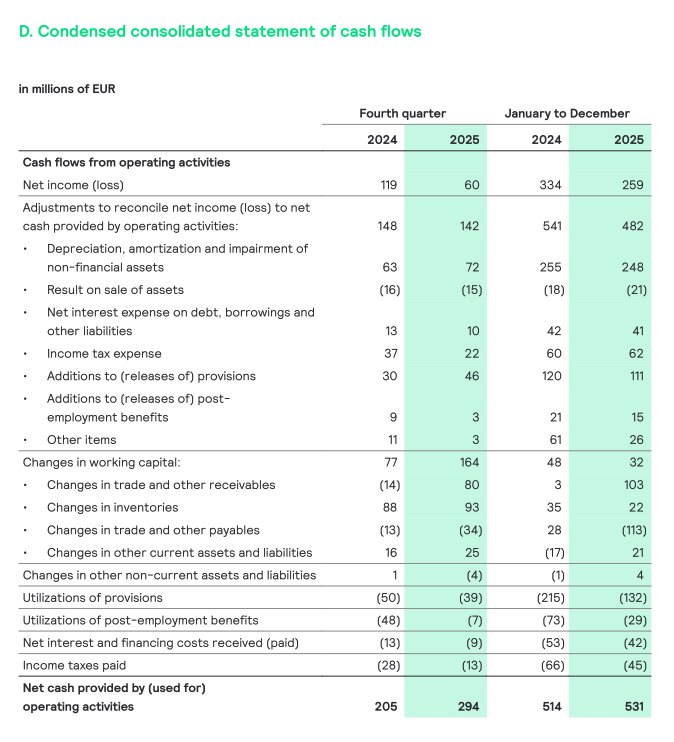
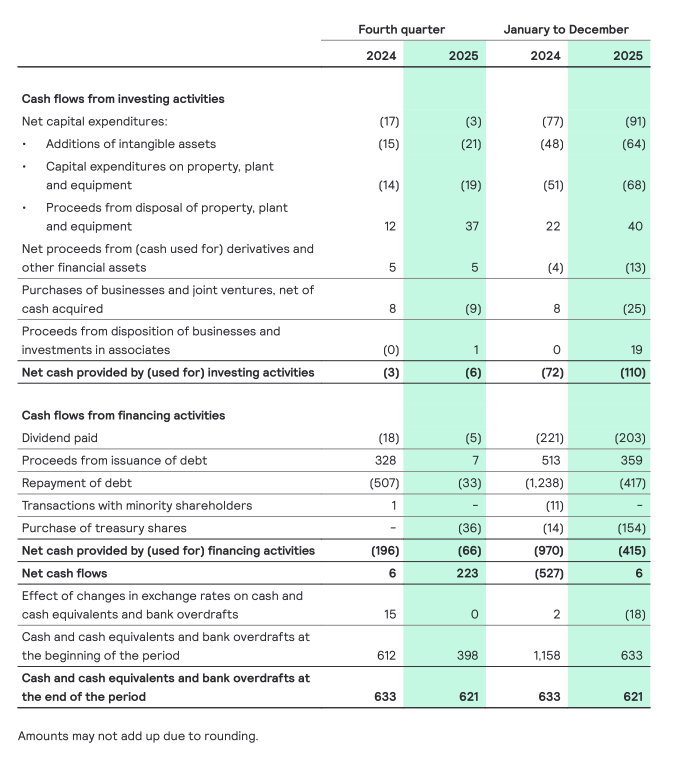
- Free cash flow of EUR 440 million (FY 24: EUR 438 million) and of EUR 291 million in Q4 25 (Q4 24: 188 million) driven by disciplined working capital management
- Repurchased shares for a total consideration of EUR 150 million; 5.8 million shares cancelled
- Proposal for cash dividend of EUR 1.57 per share over 2025 (FY24: EUR 1.56)
- Signify initiates a cost reduction program of EUR 180 million
- Signify to pause share repurchases for cancellation during portfolio and strategy review
¹ This press release contains certain non-IFRS financial measures and ratios, which are not recognized measures of financial performance or liquidity under IFRS. For further details, refer to “Non-IFRS Financial Measures” in “Important information” of this press releas
Eindhoven, the Netherlands – Signify (Euronext: LIGHT), the world leader in lighting, today announced the company’s fourth quarter & full year results 2025.
“Signify’s performance in 2025 highlighted the resilience of our business as we responded to reduced demand, the ripple effect of tariffs, and price pressure in our trade channels. In this context, our full-year results were mixed. Our Professional business grew in the US but declined in Europe. Our Consumer business delivered sustained growth in all regions except China. Connected lighting showed strong growth in both Professional and Consumer markets, but this was offset by a decline in non-connected, particularly in trade channels. Both businesses maintained a strong gross margin. OEM faced reduced demand and pricing pressure. Adjusted EBITA was 8.9%, and we generated strong cash flow of EUR 440 million, or 7.6% of sales.
In the fourth quarter, continued connected growth and a strong topline performance in the US and India was offset by declines in a number of other regions. The adjusted EBITA margin for the quarter was impacted by a lower contribution from Consumer, OEM and Conventional.” said As Tempelman, CEO of Signify.
“Through what will be a transitional year for Signify, our immediate priority is to outperform in a tough market by strengthening our commercial and operational excellence, and cost competitiveness. To drive this, we are announcing a EUR 180 million program to structurally reset our cost base, which will unfortunately impact 900 roles across Signify. To focus the business for future success, we are conducting a full strategy and portfolio review and will share our conclusions at our Capital Markets Day on June 23, 2026.
We anticipate the challenging conditions to persist through 2026. Considering the diverging dynamics in our end markets, we are not providing guidance on full-year sales at this stage. We expect an adjusted EBITA margin of 7.5-8.5%, and free cash flow generation of 6.5-7.5% of sales. We intend to pay an increased dividend of EUR 1.57 per share, while pausing share buybacks for capital reduction purposes, to preserve financial flexibility during our strategic review.
I want to thank our employees for their commitment and resilience throughout the year. Their dedication is essential as we position Signify for sustainable, profitable growth.”
Brighter Lives, Better World 2025
Having completed its Brighter Lives, Better World 2025 sustainability program, Signify will introduce its new sustainability program in the first quarter of 2026. In the final quarter of the 2025 program, Signify achieved the following results:
Double the pace of the Paris Agreement
Signify surpassed its 2025 target to reduce greenhouse gas (GHG) emissions across its entire value chain by 40% against the 2019 baseline – double the pace required by the Paris Agreement.
Double Circular revenues
Circular revenues reached 37% of sales, beyond the 2025 target of 32%. The main contribution was from serviceable luminaires in the Professional business, with strong performance in the Americas.
Double Brighter lives revenues
Brighter lives revenues were at 34% of sales, surpassing the 2025 target of 32%. This included strong contribution from consumer and special lighting products.
Double the percentage of women in leadership
The percentage of women in leadership positions remained at 27%, which did not meet the 2025 target of 34%. Signify remains committed to increasing representation through focused hiring practices for diversity across all levels, and through retention and engagement actions that reduce attrition.
Cost reduction program
The company will structurally reset its cost base and establish continuous productivity improvements, while remaining committed to its operating model.
To drive this, Signify is announcing a EUR 180 million cost reduction program. The majority of savings will be delivered through 2026, with the full benefit realized in 2027.
Outlook
Signify anticipates the challenging conditions to persist through 2026. Considering the diverging dynamics in its end markets, the company is not providing guidance on full-year sales at this stage. Signify expects an adjusted EBITA margin of 7.5-8.5%, and free cash flow generation of 6.5-7.5% of sales.
Capital allocation
Capital allocation policy
Signify’s capital allocation policy aims to
- Maintain a robust capital structure and maintain an investment grade credit rating,
- Pay an increasing annual cash dividend per share year on year,
- Continue to invest in organic and inorganic growth opportunities in line with its strategic priorities, and
- Provide additional capital return to shareholders with residual available cash.
Dividend
Signify proposes a cash dividend of EUR 1.57 per share for 2025, in line with its policy to pay an increasing annual cash dividend per share year on year. The dividend proposal is subject to approval at the Annual General Meeting of Shareholders (AGM) to be held on April 24th, 2026. Further details will be provided in the agenda for the AGM.
Share repurchases
In 2025, Signify repurchased shares for a total consideration of EUR 150 million and cancelled a total of 5.8 million shares.
Signify will pause share repurchases for cancellation while its portfolio and strategy review is underway, reflecting prudent capital discipline amid challenging industry dynamics, with a reassessment planned following the review.
Conference call and audio webcast
As Tempelman (CEO) and Željko Kosanović (CFO) will host a conference call for analysts and institutional investors at 9:00 a.m. CET to discuss the fourth quarter and full year 2025 results. A live audio webcast of the conference call will be available via the Investor Relations Website
The analyst presentation is available via this link
Financial calendar 2026
- February 24, 2026: Annual Report 2025
- April 24, 2026: First quarter results 2026
- April 24, 2026: Annual General Meeting of Shareholders
- April 30, 2026: Ex-dividend date
- May 4, 2026: Dividend record date
- May 11, 2026: Dividend payment date
- June 23, 2026: Capital Markets Day
- July 24, 2026: Second quarter results 2026
- October 23, 2026: Third quarter results 2026
Important information
Forward-Looking Statements and Risks & Uncertainties
This document and the related oral presentation contain, and responses to questions following the presentation may contain, forward-looking statements that reflect the intentions, beliefs or current expectations and projections of Signify N.V. (the “Company”, and together with its subsidiaries, the “Group”), including statements regarding strategy, estimates of sales growth and future operational results.
By their nature, these statements involve risks and uncertainties, and there may be many factors that could cause actual results or outcomes to differ materially from those expressed in or implied by these statements. These risks, uncertainties and other factors include macroeconomic volatility, geopolitical and regulatory changes including trade tariffs, competitive price pressure, technological disruptions, reduced governmental funding for energy efficiency and sustainability, currency risks, changes in international tax laws, effects of environmental crises, climate change and natural disasters, cybersecurity risk, and export controls and sanctions.
The above risks may not include all factors that ultimately affect the Group. Additional risks and uncertainties that are currently not known to the Group or not considered material may have a material adverse effect on the business, strategy, results of operations, financial condition and prospects of the Group, or prevent the forward-looking events discussed from occurring. The Group undertakes no duty to and will not necessarily update any of the forward-looking statements in light of new information or future events, except to the extent required by applicable law.
Market and Industry Information
All references to market share, market data, industry statistics and industry forecasts in this document consist of estimates compiled by industry professionals, competitors, organizations or analysts, of publicly available information or of the Group’s own assessment of its sales and markets. Rankings are based on sales unless otherwise stated.
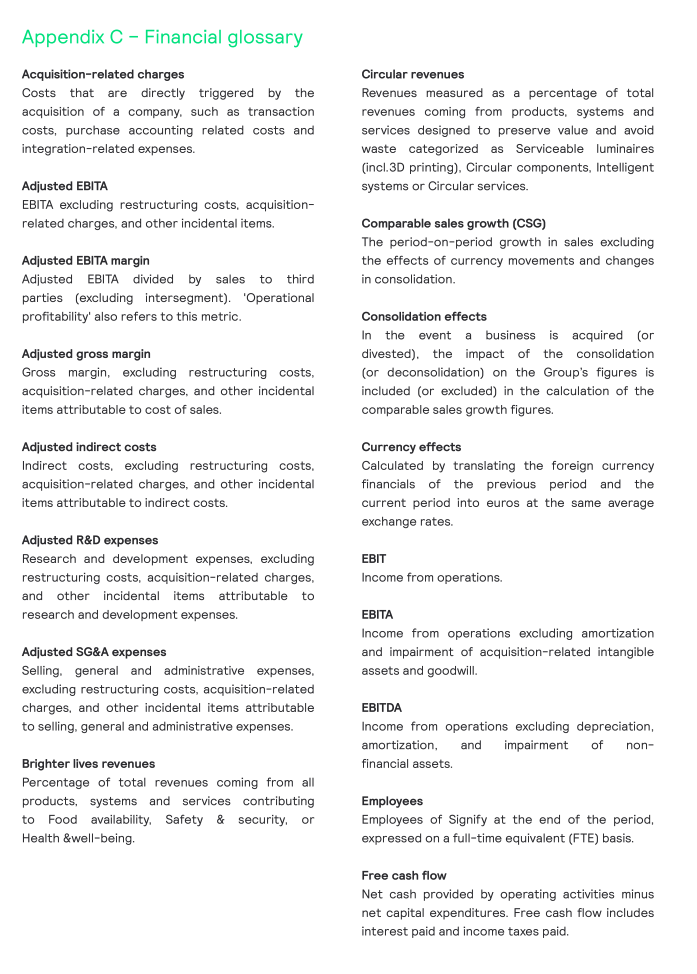
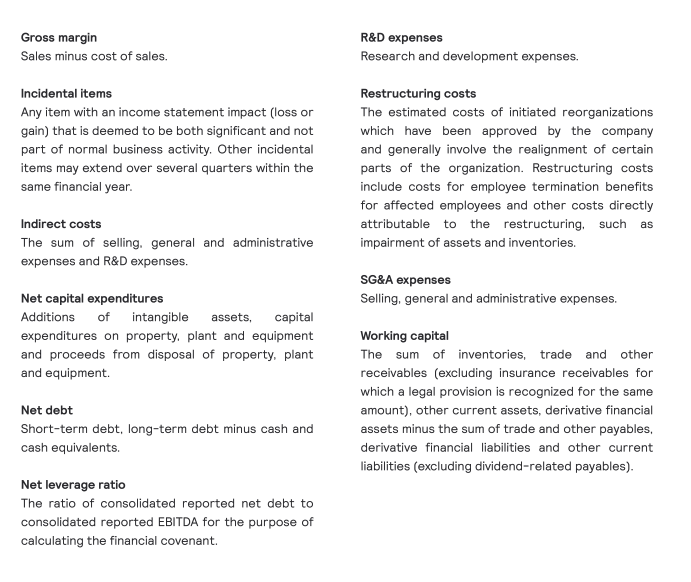
Non-IFRS Financial Measures
Certain parts of this document contain non-IFRS financial measures and ratios, such as comparable sales growth, adjusted gross margin and indirect costs, EBITA, adjusted EBITA, free cash flow, Net debt, Working capital, Brighter lives revenues, Circular revenues and other related ratios, which are not recognized measures of financial performance or liquidity under IFRS. The non-IFRS financial measures presented are measures used by management to monitor the underlying performance of the Group’s business and operations. Not all companies calculate non-IFRS financial measures in the same manner or on a consistent basis and these measures and ratios may not be comparable to measures used by other companies under the same or similar names. A reconciliation of a number of non-IFRS financial measures to the most directly comparable IFRS financial measures is contained in appendix B, Reconciliation of non-IFRS financial measures, of this document. For further information on non-IFRS financial measures, see “Chapter 18 Reconciliation of non-IFRS measures” in the Annual Report 2024.
Presentation
All amounts are in millions of euros unless otherwise stated. Due to rounding, amounts may not add up to totals provided. All reported data is unaudited. Unless otherwise indicated, financial information has been prepared in accordance with the accounting policies as stated in the Annual Report 2024 and the Semi-Annual Report 2025.
Market Abuse Regulation
This press release contains information within the meaning of Article 7(1) of the EU Market Abuse Regulation.
Financial Review
Full year
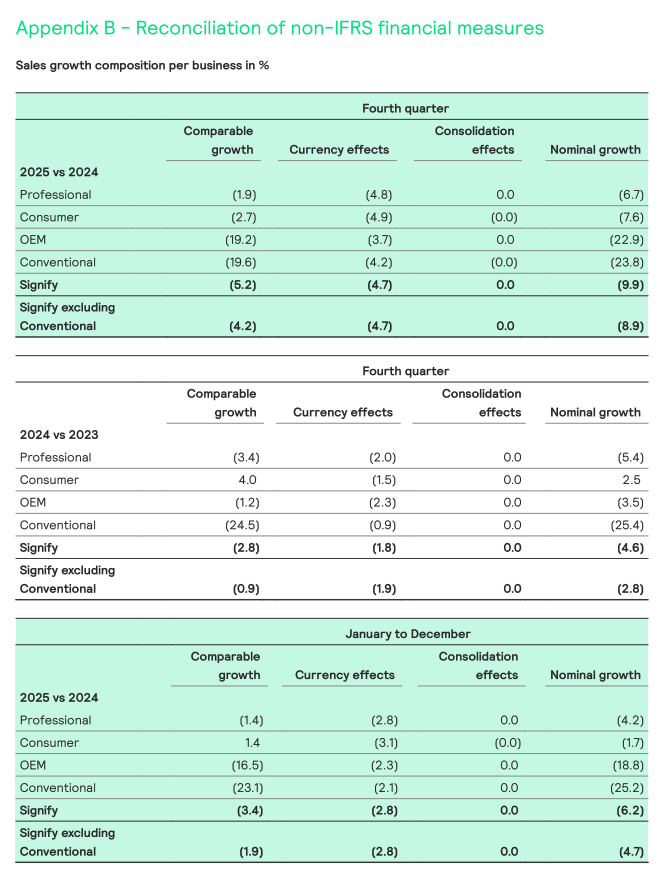
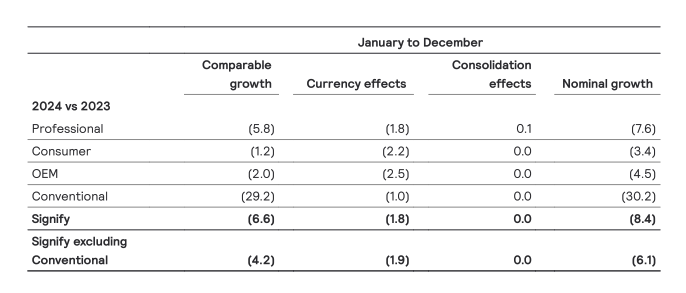
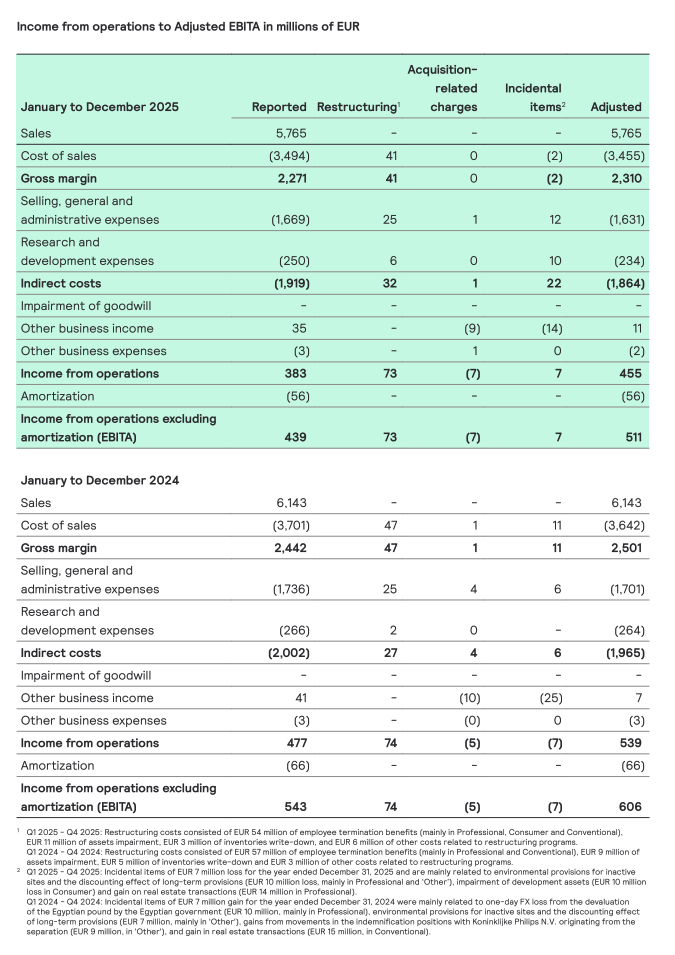
Nominal sales decreased by 6.2% to EUR 5.765 million, including a negative currency effect of 2.8% largely due to the USD depreciation. Comparable sales declined by 3.4%, as growth in the Consumer business and in the US Professional business was more than offset by continued weakness in the Professional Europe business and EM businesses. Excluding the Conventional business, Signify’s FY 25 comparable sales declined by 1.9%.
The Adjusted gross margin decreased by 60 bps to 40.1%, as positive sales mix and bill-of-material savings were offset by price pressure in some of Signify’s markets and temporary effects within the Conventional and OEM businesses. Adjusted indirect costs as a percentage of sales increased by 30 bps to 32.3%, as continued cost reductions were offset by the effect of lower volume
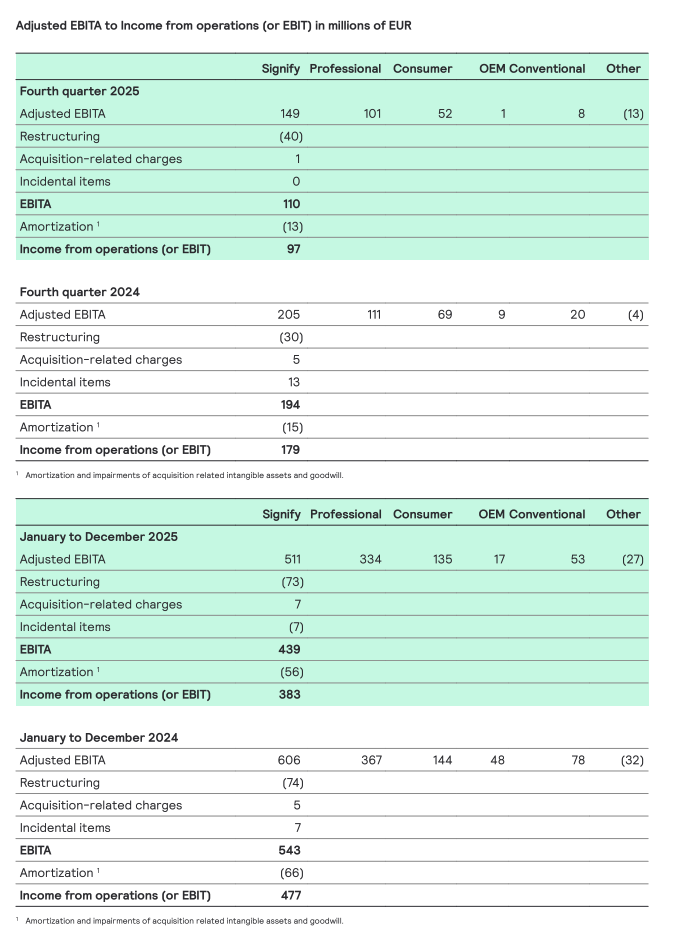
Adjusted EBITA was EUR 511 million. The Adjusted EBITA margin decreased by 100 bps to 8.9%, largely related to the lower gross margin and a higher proportion of indirect costs.
Adjusted items of EUR -72 million were mainly related to restructuring charges.
Net income decreased to EUR 259 million, mainly attributable to lower operational income.
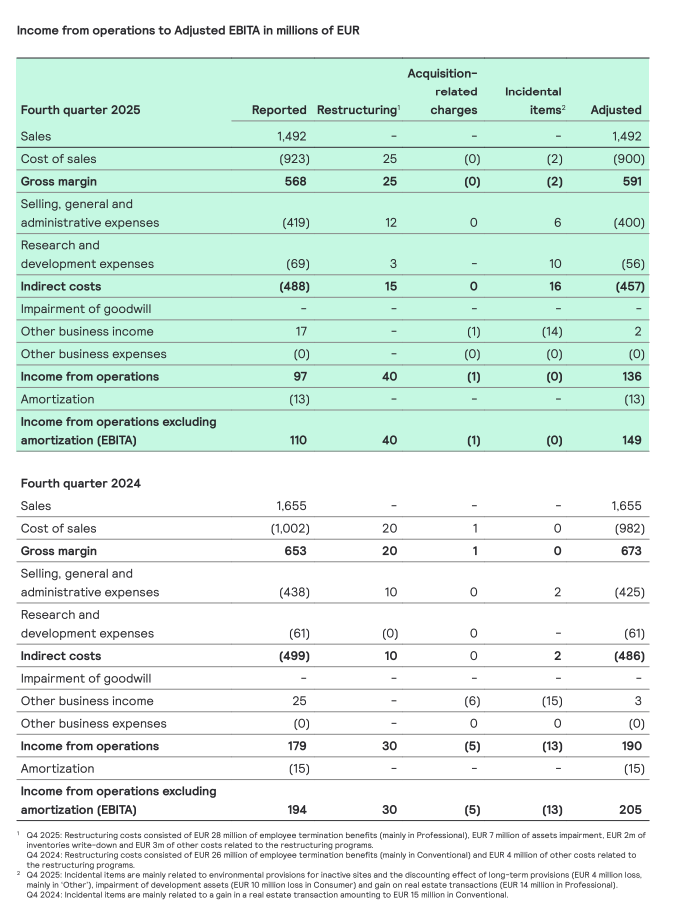
Fourth quarter
Nominal sales decreased by 9.9% to EUR 1,492 million, including a negative currency effect of 4.7% mainly related to USD depreciation. Comparable sales declined by 5.2%, reflecting weakness in OEM and Professional Europe businesses and the China Consumer business, while the US Professional business continued to grow. Excluding the Conventional business, Signify’s Q425 comparable sales declined by -4.2%.
The Adjusted gross margin decreased by 110 bps to 39.6%, largely attributable to temporarily higher manufacturing costs in the Conventional business and the competitive environment of the OEM business.
Adjusted indirect costs as a percentage of sales increased by 120 bps to 30.6%, mainly due to lower volume.
Adjusted EBITA decreased to EUR 149 million. The Adjusted EBITA margin declined to 10.0%, mainly driven by a lower contribution of the Consumer, OEM and Conventional businesses and lower results in Other.
Adjusted items of EUR -39 million were mainly due to restructuring costs, this was partly offset by a gain of EUR 14 million from a real estate transaction, other incidental items largely offset each other. In Q4 2024 adjusted items of EUR -11 million included gains related to a real estate transaction and other positive incidentals.
Net income decreased to EUR 60 milion, mainiy resulting from lower operating income and higher adjusted items.
The number of employees (FTE) decreased from 29,459 at the end of Q4 24 to 26,629 at the end of Q4 25.
The year-on-year decrease is mostly related the reduction of factory personnel due to lower production volumes. in general, the number of FTEs in affected by fluctuations in volume and seasonality.
Full year
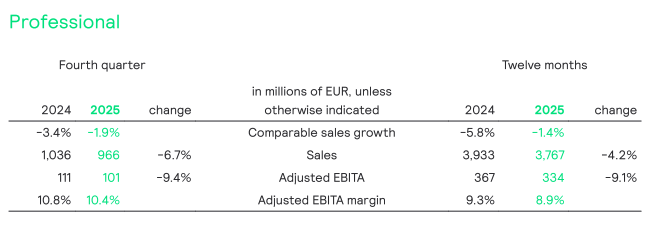
Nominal sales decreased by 4.2% to EUR 3,767 million, including a negative currency effect of 2.8% largely due to USD depreciation. Comparable sales decreased by 1.4%, as growth in the US Professional business was offset by the weakness in Europe’s Professional business, particularly in the trade channel, and in emerging markets. The Adjusted EBITA margin decreased by 40 bps to 8.9% mainly reflecting price and volume pressure in European business, while the effect of trade tariffs was mitigated.
Fourth quarter
Nominal sales decreased by 6.7% to EUR 966 million, including a negative currency effect of 4.8%.
Comparable sales decreased by 1.9%, as growth in the US was more than offset by weakness in Europe and emerging markets. The Adjusted EBITA margin decreased by 40 bps to 10.4% mainly due to lower fixed cost absorption, while the gross margin remained stable.
Full year
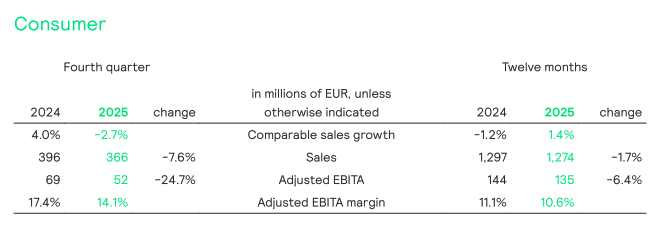
Nominal sales decreased by 1.7% to EUR 1,274 million, including a negative currency effect of 3.1% due to USD and other currencies depreciation. Comparable sales increased by 14% driven by strong connected sales throughout the year, partly offset by a decline in the non-connected business and weaker performance in China. The Adjusted EBITA margin decreased by 50 bps to 10.6%, mainly due to higher commercial investments.
Fourth quarter
Nominal sales decreased by 76% to EUR 366 million, including a negative currency effect of 4.9% Comparable sales decreased by 2.7%. While the connected home business delivered a strong year-end performance in line with expectations, this was more than offset by weaker non-connected sales and a pronounced decline in China, reflecting a subdued consumer environment. The Adjusted EBITA margin decreased by 330 bps to 14.1%, reflecting higher commercial investments in the peak season for connected products.
Full year
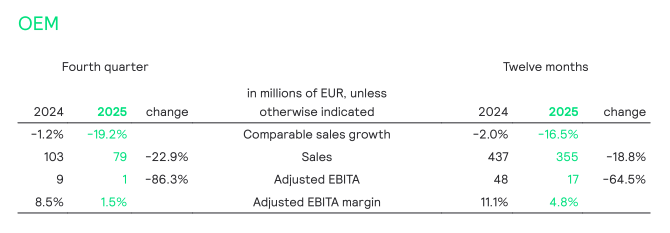
Nominal sales decreased by 18.8% to EUR 355 million, including a negative currency effect of 2.3% largely due to USD depreciation. Comparable sales decreased by 16.5%, primarily reflecting weak end-market demand and intense price pressure amid structural overcapacity in the market. This was further exacerbated by lower orders from two major customers, an effect that impacted results throughout the year. The Adjusted EBITA margin decreased to 4.8%, reflecting the impact of lower volumes and continued gross margin pressure.
Fourth quarter
Nominal sales decreased by 22.9% to EUR 79 million, including negative currency effect of 3.7%.
Comparable sales decreased by 19.2%, driven by continued weak demand and intense price pressure. The Adjusted EBITA margin decreased to 1.5%, reflecting volume declines and gross margin pressure.
Full year
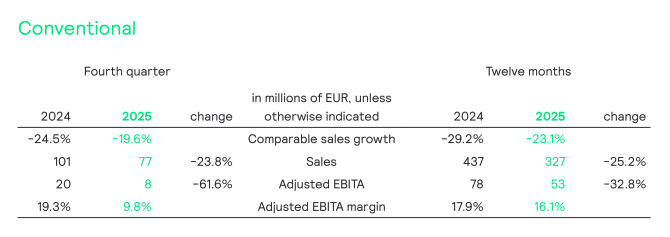
Nominal sales decreased by 25.2% to EUR 327 million, including a negative currency effect of 2.1% due to USD and CNY depreciation. Comparable sales decreased by 23.1% reflecting the structural decline of the business. The Adjusted EBITA margin decreased by 180 bps to 16.1%.
Fourth quarter
Nominal sales decreased by 23.8% to EUR 77 million, including a negative currency effect of 4.2%.
Comparable sales decreased by 19.6%. The Adjusted EBITA margin decreased to 9.8%, reflecting the full-quarter impact of the site rationalization, resulting in temporarily higher manufacturing costs. This effect is expected to normalize in H2 2026. Additionally, profitability was impacted by a lag effect of tariff-related costs.
Other
Full year
Other’ reflects the P&L of Signify’s venture businesses, in addition to centrally incurred costs not assigned to individual businesses, predominantly those related to exploratory research initiatives and audit activities.
Adjusted EBITA was EUR -27 million (2024: EUR -32 million).
Fourth quarter
Adjusted EBITA was EUR – 13 million (04 24: EUR -4 million) mainly due to lower sales in Signify’s ventures, affecting both topline and adjusted EBITA.
SourceSignify
EMR Analysis
More information on Signify: See the full profile on EMR Executive Services
More information on As Tempelman (Member of the Board + Chief Executive Officer, Signify): See the full profile on EMR Executive Services
More information on Željko Kosanović (Member of the Board + Chief Financial Officer + Senior Vice President, Group Controller, Signify): See the full profile on EMR Executive Services
EMR Additional Financial Notes:
- Major financial KPI’s since 2017 are available on EMR Executive Services under “Financial Results” and comparison with peers under “Market Positioning”
- Companies’ full profile on EMR Executive Services are based on their official press releases, quarterly financial reports, annual reports and other official documents.
- All members of the Executive Committee and of the Board have their full profile on EMR Executive Services
- The Signify Q4 2025 Results Report can be found here: https://www.signify.com/static/quarterlyresults/2025/q4_2025/signify-fourth-quarter-and-full-year-results-2025-report.pdf
- The Signify Q4 2025 Results Presentation can be found here: https://www.signify.com/static/quarterlyresults/2025/q4_2025/signify-fourth-quarter-and-full-year-results-2025-presentation.pdf
- The Signify Annual Report 2024 can be found here: https://www.signify.com/static/2024/signify-annual-report-2024.pdf
- The Signify Q4 and Full Year 2024 Results Report can be found here: https://www.signify.com/static/quarterlyresults/2024/q4_2024/signify-fourth-quarter-and-full-year-results-2024-report.pdf
- The Signify Q4 and Full Year 2024 Results Presentation can be found here: https://www.signify.com/static/quarterlyresults/2024/q4_2024/signify-fourth-quarter-and-full-year-results-2024-presentation.pdf
- The Signify comparable financials for 2023 and Q1 2024 following implementation of new organizational structure can be found here: https://www.assets.signify.com/is/content/Signify/Assets/signify/global/news/2024/20240614-signify-publishes-comparable-financials-for-2023-and-q1-2024.pdf
- The Signify Annual Report 2023 can be found here: https://www.signify.com/static/2022/signify-annual-report-2022.pdf
- The Signify Q4 and full-year results 2023 Report can be found here: https://www.signify.com/static/quarterlyresults/2023/q4_2023/signify-fourth-quarter-and-full-year-results-2023-report.pdf
- The Signify Q4 and full-year results 2023 Presentation can be found here: https://www.signify.com/static/quarterlyresults/2023/q4_2023/signify-fourth-quarter-and-full-year-results-2023-presentation.pdf
- The Signify Annual Report 2022 can be found here: https://www.signify.com/static/2022/signify-annual-report-2022.pdf
- The Signify Q4 2022 Presentation can be found here: https://www.signify.com/static/quarterlyresults/2022/q4_2022/signify-fourth-quarter-and-full-year-results-2022-presentation.pdf
- The Signify Business Highlights 2022 Video can be found here: https://www.signify.com/global/our-company/news/press-releases/2023/20230127-signify-fourth-quarter-and-full-year-results-2022