Rexel – Q4 sales & FY 2025 results

- Sequential sales growth improvement in Q4 in all geographies
- Meeting or exceeding all full-year objectives
- Axelerate 2028 implementation and deeper productivity initiatives bearing fruit
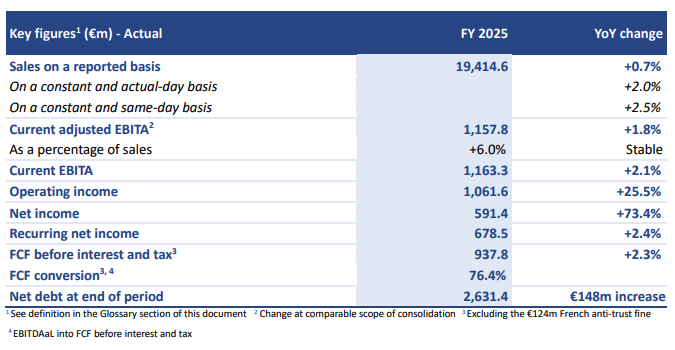
→ FY 25 sales of €19,414.6m, boosted by organic growth and acquisitions
- Same-day sales increased by +2.5% in FY 2025, with improving trends quarter after quarter
- Q4 sales of €4,881.1m, rose +3.8% on a same-day basis (up +4.7% on an actual-day basis), accelerating sequentially with positive momentum in all regions
- Continued market share gains boosted by digitalization best-in-class services in key countries including France, US, Canada, Austria and Sweden
- Active acquisitions strategy contributing for +1.8% to FY 25 sales growth
→ FY 25 current adjusted EBITA margin at 6.0% up +10bps versus the 5.9% reported in 2024, demonstrating market outperformance and margin resilience in a challenging environment
- Structural cost actions and rapid cost adaptation to mitigate opex inflation: average FTE reduced by (2.3)% while volume increased by +0.7% on actual-day basis
→ FY 25 operating income stood at €1,061.6m (vs €845.9m in FY 24), including exceptional items (restructuring, asset impairment, capital gains on disposals)
→ Net income 2025 of €591.4m up +73%; recurring net income up +2.4% at €678.5m
→ Free cash flow conversion at 66.3%, or 76.4% excluding the impact of the €124m French Competition Authority fine paid in April, significantly outpacing our guidance for the third consecutive year and confirming our cash-generative model
→ Delivering on portfolio management strategy and return to shareholders while maintaining a robust balance sheet with an indebtedness ratio at 2.0x:
- M&A: close to €200 million of value-creating acquisitions completed
- Portfolio management: divestment of activities in Finland and New Zealand
- Proposed dividend for 2025 of 1.20€ per share, a 52% payout ratio, maintaining a strong track record
- Share buyback: €100 million of shares repurchased in 2025; €400 million since mid-2022
- 296 million outstanding shares at end of 2025 vs 307 million shares mid-2022
→ 2026 outlook: 3% to 5% same-day sales growth, current adjusted EBITA margin at c. 6.2% and free cash flow conversion above 65%
→ Confirmation of Rexel’s medium-term ambitions, with continued market outperformance and execution of Axelerate 2028 strategic plan
Guillaume TEXIER, Chief Executive Officer, said: “Despite another year of macroeconomic headwinds, Rexel delivered a very solid performance in 2025, reflecting the commitment of our teams, the strength of the ‘new Rexel’ and the resilience of our transformed business model. We grew same-day sales by 2.5%, improved our current adjusted EBITA margin to 6% and achieved adjusted free cash flow conversion above 75% for the third straight year, while continuing to outperform markets in our key countries. In North America, we captured strong momentum in high-growth verticals such as datacenters and broadband infrastructure, supported by our key accounts organization and the successful Talley integration. In Europe, we intensified our self-help actions, including significant cost resets in several countries, to adapt to still-demanding conditions and deliver sequential improvement. At the same time, we mobilized the Group behind Axelerate 2028 and launched deeper transformation initiatives across AI, digital platforms, sales excellence and cost efficiency that will yield ongoing benefits over the next three years. In the Mid-term, our disciplined execution, combined with structural electrification and AI-driven opportunities, underpins our confidence in delivering profitable growth and achieving our ambitions.”
Financial review for the period ended December 31, 2025
- This press release presents Rexel’s consolidated financial statements for the year ended December 31, 2025. The audit procedures by the Statutory Auditors are in progress and their report on the consolidated financial statements for the year ended December 31, 2025 will be issued on February 12, 2026
- The full year 2025 financial report was authorized for issue by the Board of Directors on February 11, 2026
- The following terms are defined in the Glossary section of this document: Current EBITA; Current adjusted EBITA, EBITDA; EBITDAaL; Recurring net income; Free Cash Flow and Net Debt
- Unless otherwise stated, all comments are on a constant and adjusted basis and, for sales, at same number of working days
Main FY 2025 figures
SALES
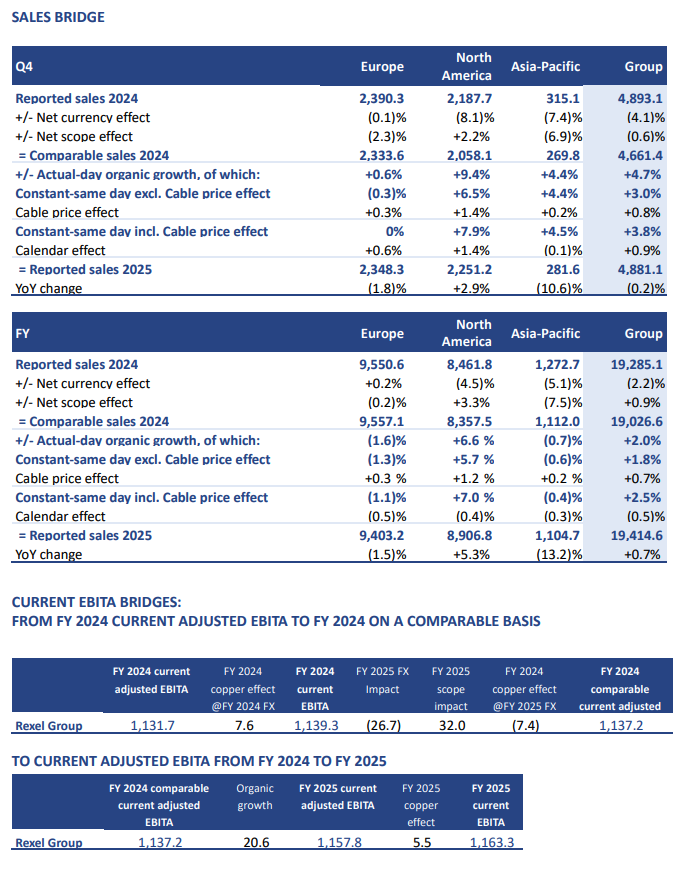
Q4 sales stable at (0.2)% year-on-year on a reported basis, up +3.8% on a constant and same-day basis
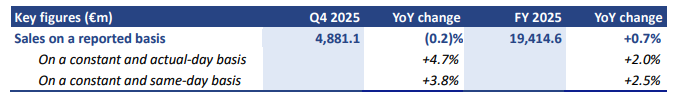
In Q4 2025, Rexel posted sales of €4,881.1m, broadly stable (0.2)% on a reported basis with positive organic growth offset by disposals and forex impacts. This includes:
- Constant and same-day sales growth of +3.8% with:
- volume growth acceleration (+2.1% contribution) and sequential selling price improvement compared to Q3 25, mainly driven by cable products (+0.8% contribution). The non-cable pricing remains unchanged (+0.9% contribution) compared to Q3 25 with improved situation in North America mainly offset by China
- a sequential improvement in all geographies compared to Q3 25
- A positive calendar effect of +0.9%
- A negative net scope effect of (0.6)%, resulting from the divestment of Rexel’s New Zealand and Finland operations (respectively deconsolidated from Feb.1st and Sept.1st, 2025), offset by the acquisitions in North America (Warshauer, Schwing, Jacmar, Talley, Electrical Supplies Inc) and in Europe (Tecno Bi)
- A negative currency effect of (4.1)%, mainly due to the depreciation of the US and Canadian dollars, and to a lesser extent the Australian dollar, renminbi and British Pound, against the euro
FY sales up +0.7% year-on-year on a reported basis, +2.5% on a constant and same-day basis
In FY 2025, Rexel posted sales of €19,414.6m, up +0.7% on a reported basis, reflecting positive organic and M&A contributions. This performance includes:
- Constant and same-day sales growth of +2.5%, with contributions of +1.2% from volume, +0.6% from non-cable selling prices and +0.7% from cable product selling prices
- A negative calendar effect of (0.5)%
- A positive net scope effect of +0.9%, mainly resulting from acquisitions of Talley, Itesa, Warshauer, Schwing, Electrical Supplies Inc, Jacmar and Tecno Bi, net of the New Zealand and Finland disposals
- A negative currency effect of (2.2)%, mainly due to the depreciation of the US and Canadian dollars, and to a lesser extent the Australian dollar and renminbi, against the euro
Digital sales in 2025 increased by +226bps to represent 34% of total Group sales:
- Digital accounted for 44% of sales in Europe, up +107bps; 25% in North America, an increase of +347bps driven by rapid adoption of Digital/AI tools; and 27% in Asia-Pacific, vs 17% in FY 24
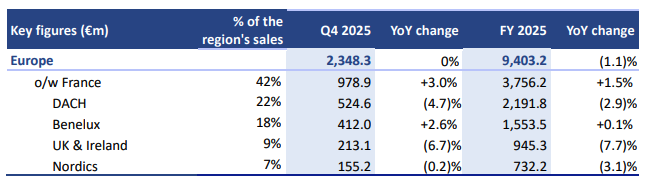
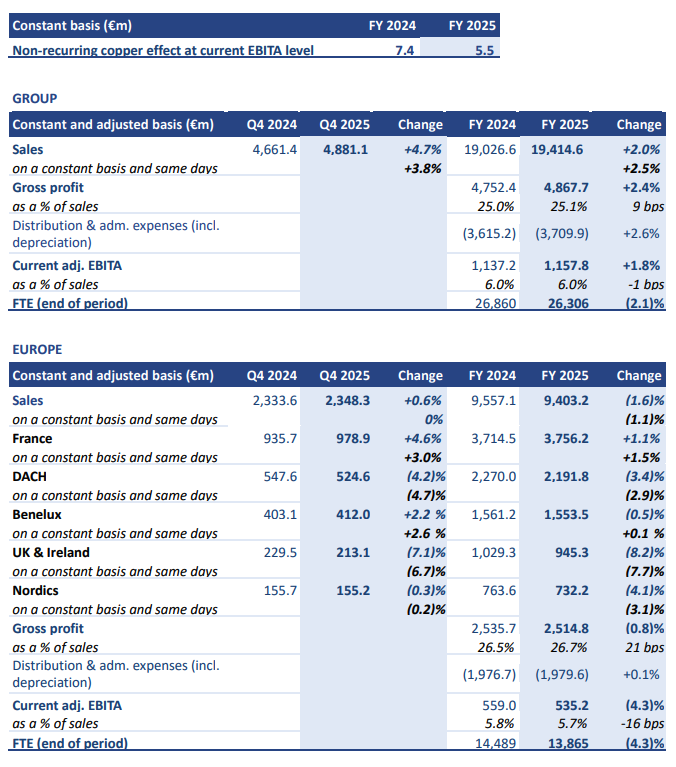
Europe (48% of Group sales): Stable sales evolution in Q4, down (1.1)% in FY 2025 on a constant and sameday basis
In Q4 25, sales growth evolution in Europe stood at (1.8)% on a reported basis, including:
- Stable constant and same-day sales
- A positive calendar effect of +0.6%
- A negative net scope impact of (2.3)%, from the disposal of Finland mitigated by the acquisition of Tecno Bi in Italy
- A stable currency effect of (0.1)%
- Europe was flat on a same-day basis year-on-year, while improving sequentially compared to (0.5)% in Q3 25, in an environment that remains challenging. More specifically:
- Volumes were stable (vs Q3 25) in a soft market affected by political and macro uncertainties
- Pricing in Q4 25 slightly improved versus Q3 25, driven mainly by cable pricing (similar non-cable selling price contribution)
- Excluding Solar (4.5% of sales), same-day sales growth was up +0.5%
- By market:
- The residential market was flat, excluding Solar, with first sign of recovery in some countries such as in Sweden and in the Netherlands
- Non-residential was flat
- Industry slightly increased
- Trends by country and cluster (same-day basis):
- France increased by +3.0% in a challenging environment, achieving further broad-based marketshare gains, with a strong contribution from HVAC
- Sequential deterioration in DACH region (Germany, Austria, Switzerland), down (4.7)%, on business selectivity particularly in the non-residential segment, amid a difficult macro environment. However, the Group increased market share in Austria
- Benelux increased by +2.6% driven by Dutch ED activity and accelerated Solar growth in Belgium
- UK & Ireland down (6.7)%, with positive momentum in Ireland driven by industry mitigating a tough UK market, except in the London area benefiting from our recent investments
- Sweden was flat, a sequential improvement notably driven by industrial segment and a lower negative impact from Solar (-250bps Q4 contribution vs -650bps in Q3 2025)
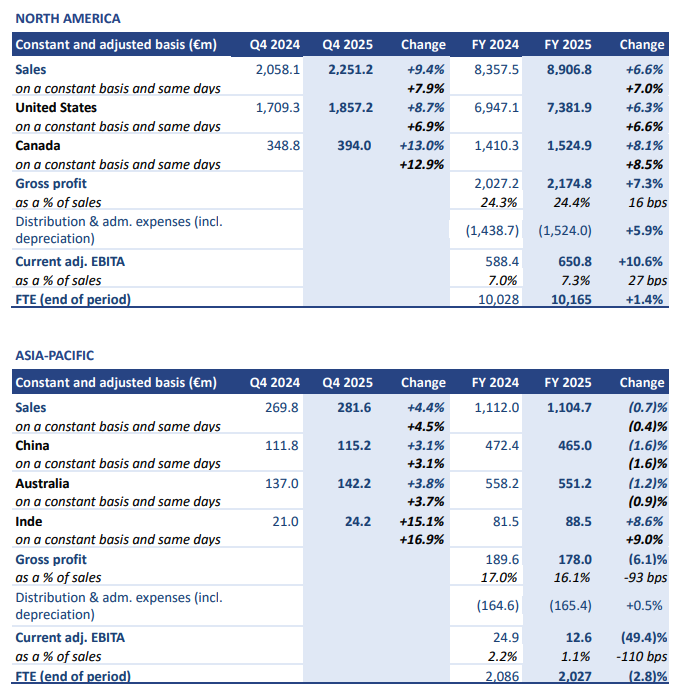
North America (46% of Group sales): Strong sales growth of +7.9% in Q4 and +7.0% in FY 2025 on a constant and same-day basis
In Q4 25, North America sales were up by +2.9% on a reported basis, including:
- Strong constant and same-day sales growth of +7.9%
- Positive calendar effect of +1.4%
- Positive scope effect of +2.2%, resulting from the acquisitions of Warshauer, Schwing, Talley & Electrical Supplies Inc in the US, and Jacmar in Canada
- Negative currency effect of (8.1)%, due to the depreciation of the US and Canadian dollars against the euro
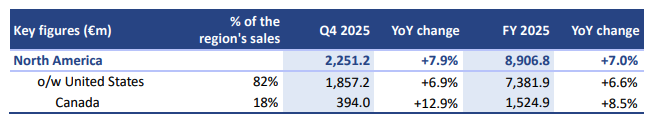
Sales rose +7.9% on a same-day basis, with all three markets positive. In more details:
- The acceleration was driven by non-residential, particularly datacenter activity in Canada
- While US was driven by proximity activity, projects were the main growth driver in Canada
- Non-cable pricing was slightly better compared to Q3 25 thanks to further improvement in piping/conduit products
- Backlog remains solid representing 2.7 months of activity at year end, similar to the previous quarter
More specifically:
- US same-day sales were up +6.9% in Q4 2025
- High-growth verticals (datacenters and broadband infrastructure) contributed for more than 55% of US growth
- Industrial automation business accelerated, up +8%, while residential remained positive (driven by the Northwest region)
- Demand was strong in Solar and EV charging
- Canada saw significant sales growth acceleration in Q4, up +12.9% on a same-day basis, driven by non-residential activity and market share gains
- Strong activity in Datacom
- Demand in datacenter significantly accelerated (Project in the Western region) representing 7.5% of sales in the quarter.
Asia-Pacific (6% of Group sales): Sales increased by +4.5% in Q4 and decreased by (0.4)% in FY 2025 on a constant and same-day basis
In Q4 25, Asia-Pacific sales decreased by (10.6)% on a reported basis, including:
- Constant and same-day sales increase of +4.5%
- Stable calendar effect of (0.1)%
- Negative scope effect of (6.9)%, resulting from the disposal of Rexel’s New Zealand activities
- Negative currency effect of (7.4)%, mainly due to the depreciation of the Australian dollar and the renminbi against the euro
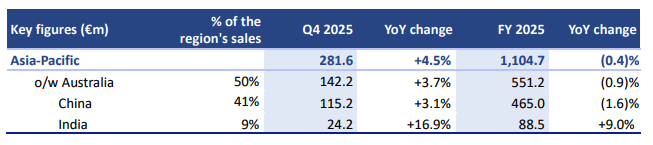
In Asia-Pacific, Q4 25 sales increased by +4.5% on a constant and same-day basis
- In Australia, sales growth accelerated in the quarter, up +3.7%, notably boosted by Solar activity (supported by battery subsidies)
- In Asia, China and India sales grew by respectively +3.1% and +16.9% supported by industrial automation activity.
PROFITABILITY
Current adjusted EBITA margin at 6.0% in 2025, up +10bps versus 5.9% reported in 2024
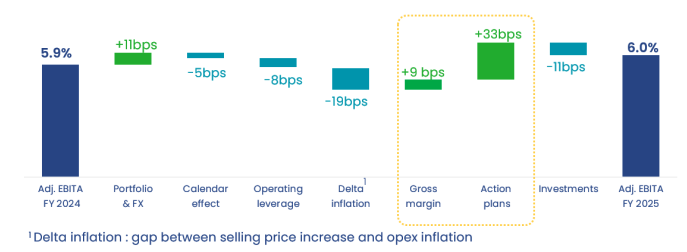
In a low-growth environment marked by a +2.0% actual-day sales increase in FY 2025, profitability was resilient as reflected by the current adjusted EBITA margin of 6.0% up +10bps versus the 5.9% adjusted EBITA margin reported in 2024 (and stable on a comparable basis)
More specifically, this margin progression can be split between the different building blocks:
- Portfolio & FX effect contributed for +11bps mainly thanks to accretive portfolio operations with positive contributions from both acquisitions and disposals • Calendar effect stood at -5bps
- Operating leverage stood at -8bps, mainly due to muted environment in Europe;
- Delta inflation (gap between selling price increase and operating cost inflation) had a negative impact of -19bps, improving vs H1 mainly due to better selling price increase
- Operating-cost inflation stood at +2.2% (+2.9% from wage increases and +2.0% from other operating expenditure including right-of-use depreciation) versus selling price increase up +1.3%
- This was more than offset by internal actions on Gross Margin as well as cost savings & productivity initiatives
- Gross Margin was up +9bps representing a robust achievement in a competitive environment. This was supported by active selling price management.
- Action plans contributed for +33bps, in line with expectations
- Finally, opex investments for growth (mainly digital) impacted adjusted Ebita margin by -11bps
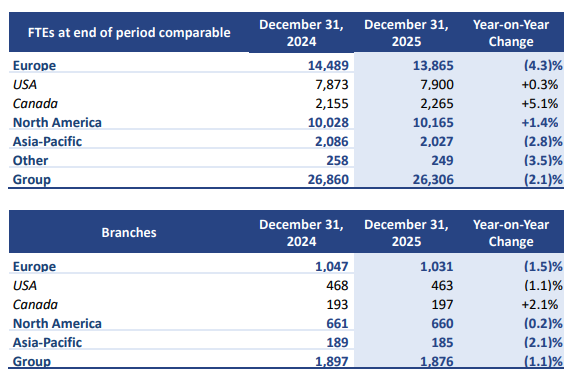
Compared to previous cycles, Rexel continues to demonstrate its capacity to adapt its cost base in a challenging sales environment. This was achieved in particular through productivity initiatives, with headcount reduction reaching (2.3)% in 2025 (vs 2024), while volume was up +0.7% on an AD growth basis
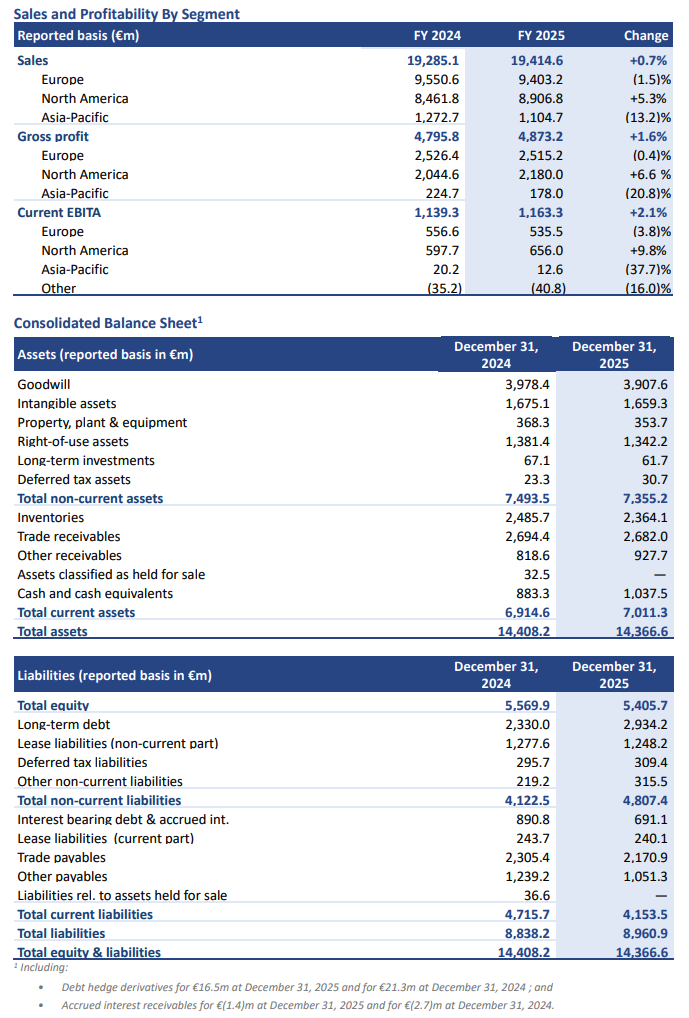
By geography, the change in current adjusted EBITA margin in 2025 can be explained as follows:
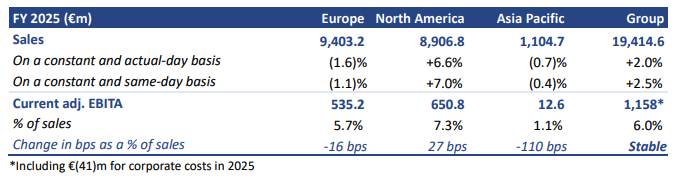
More specifically:
- Europe was down -16 bps at 5.7% of sales, resulting from negative operating leverage, mainly due to the under-absorption of fixed costs notably in underperforming countries, partly mitigated by rapid cost adaptation with a reduction of 4% of the workforce (-600 FTE on average in 2025)
- North America was up +27 bps at 7.3% of sales, thanks to positive sales momentum, effects from tariffs on selling prices and strict operating expenditure discipline (unchanged FTE in a growing environment)
- Asia-Pacific was down -110 bps at 1.1% of sales, in a more competitive environment notably in China.
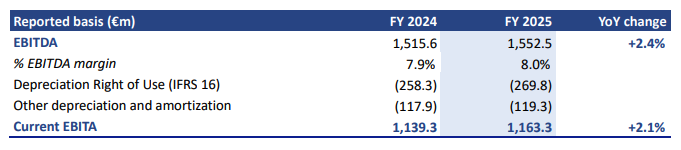
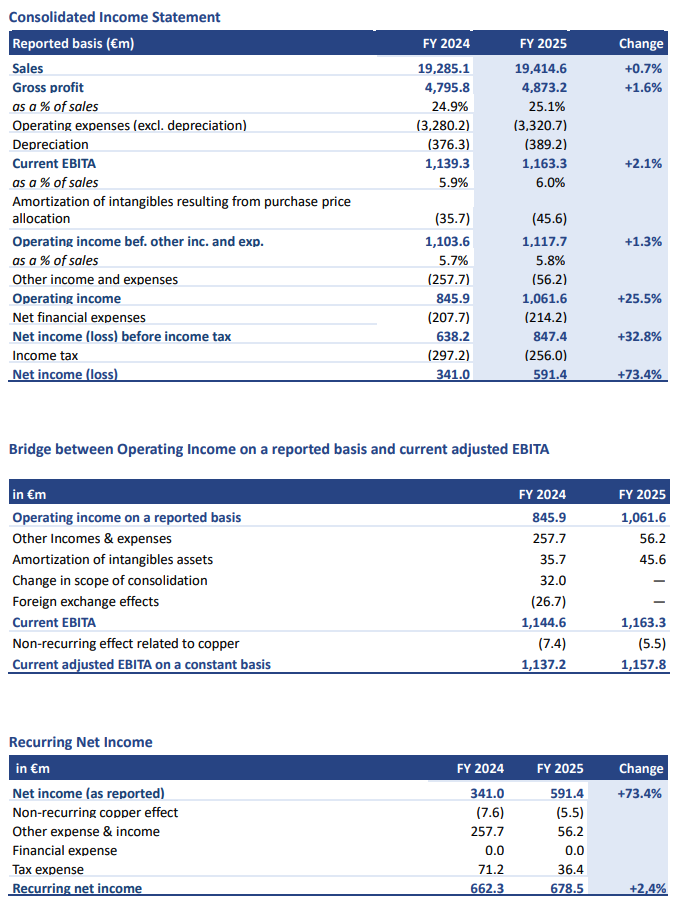
As a result, current adjusted EBITA stood at €1,157.8m (vs €1,137.2m in 2024 on a comparable basis) and current EBITA stood at €1,163.3m (including a positive one-off copper effect of €5.5m similar to €7.4m in 2024).
Focus on the bridge from reported EBITDA to current EBITA:
- EBITDA margin was up +14bps at 8.0% on a reported basis
- Right-of-use depreciation stood at €(269.8)m vs €(258.3)m in 2024, mainly resulting from lease inflation and additional investment in logistic capacity notably in the US
- Other depreciation and amortization stood at €(119.3) million, or 0.6% of sales
NET INCOME
Net income of €591.4 million up +73% in FY 2025; recurring net income of €678.5 million up +2.4%
Operating income in the year stood at €1,061.6m (vs €845.9m in 2024)
- Amortization of intangible assets resulting from purchase price allocation amounted to €(45.6)m (vs €(35.7)m in 2024), explained by recent acquisitions, notably Talley
- Other income and expenses amounted to a net charge of €(56.2)m (vs a net charge of €(257.7)m in 2024, including the 124m€ fine booked in 2024) and notably included:
- €(41.1)m in restructuring mainly in Europe
- €36.0m in capital gains on disposals
- €(29.7)m in asset impairment, mainly in the UK
- €(20.4)m in other, including integration costs and pension buy-in in Canada
Net financial expenses in the year amounted to €(214.2)m (vs €(207.7)m in 2024), and can be broken down as follows:
- €(141.9)m from financial costs stable compared to €(141.5)m in 2024, reflecting better cost of debt and higher gross debt. The effective interest rate decreased to 3.96% in 2025 from 4.35% in 2024
- €(72.2)m from interest on lease liabilities in 2025 vs €(66.2)m in 2024, reflecting impact from acquisitions and inflation
Income tax in the year represented a charge of €(256.0)m (vs €(297.2)m in 2024)
- The tax rate stood at 30.2% in 2025, including the impact of the exceptional tax in France of €23.5m
- The normative tax rate stood at 30% in 2025, or 27% excluding the exceptional tax in France
As a result, net income in the year stood at €591.4m up +73% (vs €341.0m in 2024) and recurring net income amounted to €678.5m up +2.4% vs 2024 (see Appendix 3)
FINANCIAL STRUCTURE
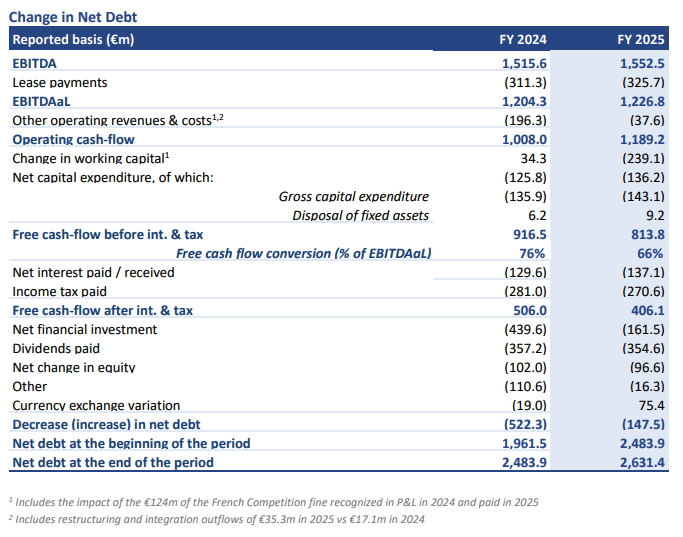
Free cash-flow before interest and tax of €937.8m in 2025, excluding the French Authority fine
Indebtedness ratio of 2.03x on December 31, 2025
In 2025, free cash flow before interest and tax reached €813.8m (vs €916.5m in 2024), representing a free cash flow conversion rate (EBITDAaL into FCF before interest and taxes) of 66.3%. Excluding the €124m fine imposed by the French Competition Authority and paid in April 2025, FCF before interest and tax stood at €937.8m, representing a 76.4% conversion rate, above the average for the last four years
This included:
- EBITDAaL of €1,226.8m of which €(325.7)m of lease payments in 2025
- Operating cash flow of €1,189.2m, notably including €(68.9)m of other operating revenue and costs
- An outflow of €(239.1)m from change in working capital (compared to an inflow of €34.3m in 2024)
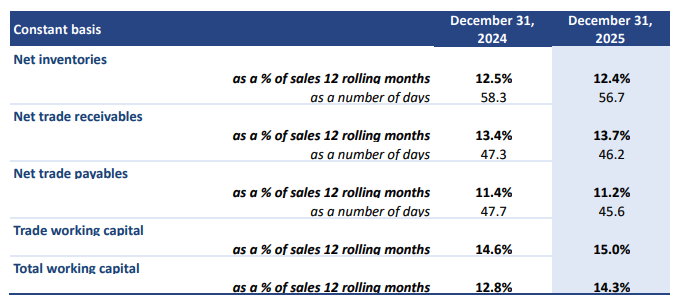
- The change in trade working capital was an outflow of €(138.7)m. On a constant basis, trade Working Capital Requirements (TWCR) stood at 15.0% of sales in 2025, (vs 14.6% in 2024), mainly related to the sales growth acceleration in Q4. In number of days, both Inventories & Receivables improved, partly offsetting deterioration in payables. DOI & DSO improved by respectively 1.5 and 1 day
- The change in non-trade working capital was an outflow of €(100.4)m, including the €(124)m French Competition Authority fine paid in April.
- Net capital expenditure of €(136.2)m (vs €(125.8)m in 2024). Gross capital expenditure represented 0.7% of sales, a broadly stable level year-on-year, with continued investment in digital, branches and supply-chain.
Below FCF before interest and tax, the cash flow statement included:
- €(137.1)m in net interest paid in 2025 (vs €(129.6)m paid in 2024);
- €(270.6)m in income tax paid in 2025, compared to €(281.0)m paid in 2024;
- €(161.5)m in financial investment mainly including Warshauer, Schwing, Jacmar and Tecno Bi acquisitions, net of the inflow from disposals (Finland and New Zealand)
- €(354.6)m in dividends paid in 2025 based on 2024 earnings (€1.20 per share);
- €(100.0)m in share buybacks;
- €75.4m in currency effects (vs €(19.0)m in 2024) mainly due to the USD depreciation
At December 31, 2025:
- Net financial debt increased by €147.6m year-on-year to €2,631.4m (vs €2,483.9m on December 31, 2024), including €28.6m for an earn-out for Talley and put option for Mavisun and Tecno-BI.
- The indebtedness ratio (net financial debt/EBITDAaL) stood at 2.03x, as calculated under Senior Credit Agreement terms.
Proposed dividend for 2025 at 1.20€ per share
Rexel will propose to maintain the dividend at 1.20€ per share, to be paid fully in cash. This represents a payout of 52% of the Group’s recurring net income, in a high end of the policy of distributing at least 40% of recurring net income.
This dividend, payable in cash on May 13th, 2026 (ex-dividend date on May 11th), is subject to the approval of the Annual Shareholders’ Meeting to be held in Paris on April 22, 2026.
Outlook
In 2026, we anticipate contrasted trends between the different regions, more specifically:
- Further growth in North America with:
- Macro uncertainties following the introduction of tariffs
- Less traction from sustainable electrification solutions
- Further progression in datacenter, lower contribution from broadband infrastructure
- Positive trends in industrial automation supported by new legislation “One Beautiful Bill” and reshoring
- Improving trends in Western Europe, especially in H2:
- Continued challenging environment with construction market at trough
- Lack of consumer confidence, amid macro and political uncertainties ◦
- asier comparison base for electrification trends
- Lower interest-rate environment starting to have positive impact on leading indicators in the residential market
- German infrastructure plan could be materialized in the second part of the year
- Selling prices increase and opex inflation:
- Opex inflation to remain higher than selling price increase
- Carry-over of 2025 selling pricing in the US
- Potential additional price increases to reflect recent copper price increase
In this uncertain overall environment, the priority will be to offset the cost inflation headwind and preserve our profitability, notably thanks to
- The full-year effect of 2025 cost-reduction action plans
- New 2026 savings actions kicking in
In this context, Rexel’s expectations for full-year 2026 are as follows:
- Same-day sales growth between 3% and 5%
- Current adjusted EBITA margin1 at c. 6.2%
- Free cash flow conversion2 above 65%
1 Excluding (i) amortization of PPA and (ii) the non-recurring effect related to changes in copper-based cable prices.
2 FCF Before interest and tax/EBITDAaL
Rexel’s medium-term ambitions remain unchanged
- Sales growth potential of between 5% and 8%, with targeted M&A representing between 2% and 3%
- Current adjusted EBITA margin above 7%
- An average conversion rate of 65% of EBITDAaL into Free Cash Flow before interest and tax
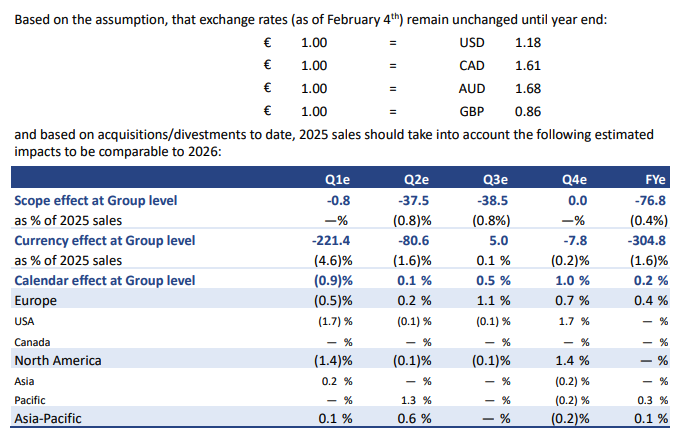
NB: The estimated impacts per quarter of (i) calendar effects by geography, (ii) changes in the consolidation scope and (iii) currency fluctuations (based on assumptions of average rates over the rest of the year for the Group’s main currencies) are detailed in appendix 6
CALENDAR
- April 22, 2026 Q1 2026 sales
- April 22, 2026 Annual Shareholders’ Meeting
- May 11, 2026 Detachment date of the dividend
- May 13, 2026 Dividend payment
FINANCIAL INFORMATION
Full year 2025 financial report is available on the Group’s website (www.rexel.com). A slideshow of the fourth quarter sales and full year 2025 results publication is also available on the Group’s website.
GLOSSARY
CURRENT EBITA (Earnings Before Interest, Taxes and Amortization) is defined as operating income before amortization of intangible assets recognized upon purchase price allocation and before other income and other expenses.
CURRENT ADJUSTED EBITA is defined as current EBITA excluding the estimated non-recurring net impact from changes in copper-based cable prices.
EBITDA (Earnings Before Interest, Taxes, Depreciation and Amortization) is defined as operating income before depreciation and amortization and before other income and other expenses.
EBITDAaL is defined as EBITDA after deduction of lease payment following the adoption of IFRS16.
RECURRING NET INCOME is defined as net income restated for non-recurring copper effect, other expenses and income, non-recurring financial expenses, net of tax effect associated with the above items.
FREE CASH FLOW is defined as cash from operating activities minus net capital expenditure.
NET DEBT is defined as financial debt less cash and cash equivalents. Net debt includes debt hedge derivatives.
APPENDIX
Appendix 1: Q4 and FY 2025 sales and current adjusted Ebita bridge
Appendix 2: Segment reporting – Constant and adjusted basis*
* Constant and adjusted = at comparable scope of consolidation and exchange rates, excluding the non-recurring effect related to changes in copper-based cable prices and before amortization of purchase price allocation. The non-recurring effect related to changes in copper-based cable prices was, at the EBITA level:
Appendix 3: Consolidated Financial Statement
Appendix 4: Working Capital Analysis
Appendix 5: Headcount and branches by geography
Appendix 6: Calendar, scope and currency effects on sales
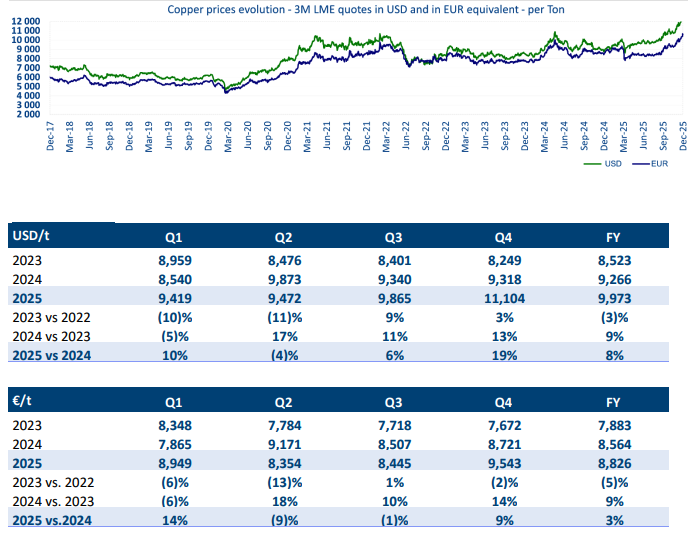
Appendix 7: Historical copper price evolution
DISCLAIMER
The Group is exposed to fluctuations in copper prices in connection with its distribution of cable products. Cables accounted for approximately 16% of the Group’s sales and copper accounts for approximately 60% of the composition of cables. This exposure is indirect since cable prices also reflect copper suppliers’ commercial policies and the competitive environment in the Group’s markets. Changes in copper prices have an estimated so-called “recurring” effect and an estimated so called “non-recurring” effect on the Group’s performance assessed as part of the monthly internal reporting process of the Rexel Group: i) the recurring effect related to the change in copper-based cable prices corresponds to the change in value of the copper part included in the sales price of cables from one period to another. This effect mainly relates to the Group’s sales; ii) the non-recurring effect related to the change in copper-based cable prices corresponds to the effect of copper price variations on the sales price of cables between the time they are purchased and the time they are sold, until all such inventory has been sold (direct effect on gross profit). Practically, the non-recurring effect on gross profit is determined by comparing the historical purchase price for copper-based cable and the supplier price effective at the date of the sale of the cables by the Rexel Group. Additionally, the non-recurring effect on current EBITA corresponds to the non-recurring effect on gross profit, which may be offset, when appropriate, by the non-recurring portion of changes in the distribution and administrative expenses.
The impact of these two effects is assessed for as much of the Group’s total cable sales as possible, over each period. Group procedures require that entities that do not have the information systems capable of such exhaustive calculations to estimate these effects based on a sample representing at least 70% of the sales in the period. The results are then extrapolated to all cables sold during the period for that entity. Considering the sales covered. the Rexel Group considers such estimates of the impact of the two effects to be reasonable.
This document may contain statements of future expectations and other forward-looking statements. By their nature, they are subject to numerous risks and uncertainties, including those described in the Universal Registration Document registered with the French Autorité des Marchés Financiers (AMF) on March 10, 2025 under number D.25-0084. These forward-looking statements are not guarantees of Rexel’s future performance, Rexel’s actual results of operations, financial condition and liquidity as well as development of the industry in which Rexel operates may differ materially from those made in or suggested by the forward-looking statements contained in this release. The forward-looking statements contained in this communication speak only as of the date of this communication and Rexel does not undertake, unless required by law or regulation, to update any of the forward-looking statements after this date to conform such statements to actual results to reflect the occurrence of anticipated results or otherwise.
The market and industry data and forecasts included in this document were obtained from internal surveys, estimates, experts and studies, where appropriate, as well as external market research, publicly available information and industry publications. Rexel, its affiliates, directors, officers, advisors and employees have not independently verified the accuracy of any such market and industry data and forecasts and make no representations or warranties in relation thereto. Such data and forecasts are included herein for information purposes only.
This document includes only summary information and must be read in conjunction with Rexel’s Universal Registration Document registered with the AMF on March 10, 2025 under number D.25-0084, as well as the financial statements and consolidated result and activity report for the 2025 fiscal year which may be obtained from Rexel’s website (www.rexel.com).
SourceRexel
EMR Analysis
More information on Rexel: See the full profile on EMR Executive Services
More information on Guillaume Texier (Chief Executive Officer, Rexel): See the full profile on EMR Executive Services
More information on Laurent Delabarre (Group Chief Financial Officer, Leading China-India Cluster, Rexel): See the full profile on EMR Executive Services
More information on Axelerate 2028 Plan by Rexel: See the full profile on EMR Executive Services
EMR Additional Financial Notes:
- Major financial KPI’s since 2017 are available on EMR Executive Services under “Financial Results” and comparison with peers under “Market Positioning”
- Companies’ full profile on EMR Executive Services are based on their official press releases, quarterly financial reports, annual reports and other official documents like the Universal Registration Document.
- All members of the Executive Committee and of the Board have their full profile on EMR Executive Services
- The Rexel Fourth Quarter Sales & FY 2025 Results Presentation can be found here: https://www.rexel.com/app/uploads/2026/01/Rexel-Fourth-quarter-sales-FY-2025-results-sans-script.pdf
- The Rexel 2024 Universal Registration Document can be found here: https://www.rexel.com/en/finance/documentation/?oo_filter_category=60&oo_filter_year=Year+of+publication&oo_filter=investors-publications
- The Rexel Fourth Quarter Sales & FY 2024 Results Presentation can be found here: https://www.rexel.com/en/finance/documentation/
- The Rexel Capital Market Days Presentation from the 7th of June 2024 can be found here: https://assets.main.pro2.maf.media-server.com/d23b5b2ba2184959bd5a6965dd3fd1b5/20240607_-_Powering_Up_Rexel_to_the_next_level.pdf
- The Rexel 2023 Universal Registration Document can be found here: https://www.rexel.com/en/finance/documentation/?oo_filter_category=60&oo_filter_year=Year+of+publication&oo_filter=investors-publications
- The Rexel Q4 2023 and Full-Year 2023 Results Presentation can be found here: https://www.rexel.com/en/finance/documentation/
- The Rexel 2022 Universal Registration Document can be found here: https://www.rexel.com/en/finance/documentation/?oo_filter_category=60&oo_filter_year=Year+of+publication&oo_filter=investors-publications
- The Rexel FY 2022 Financial Statements and Consolidated Results can be found here: https://www.rexel.com/en/finance/documentation/
- The Rexel 2022 Capital Markets Presentation can be found here: https://www.rexel.com/en/medias/events/fourth-quarter-sales-and-full-year-2022-results/
- The Rexel 2021 Universal Registration Document can be found here: https://www.rexel.com/en/finance/documentation/?oo_filter_category=60&oo_filter_year=Year+of+publication&oo_filter=investors-publications