Hubbell – Hubbell reports third quarter 2025 results


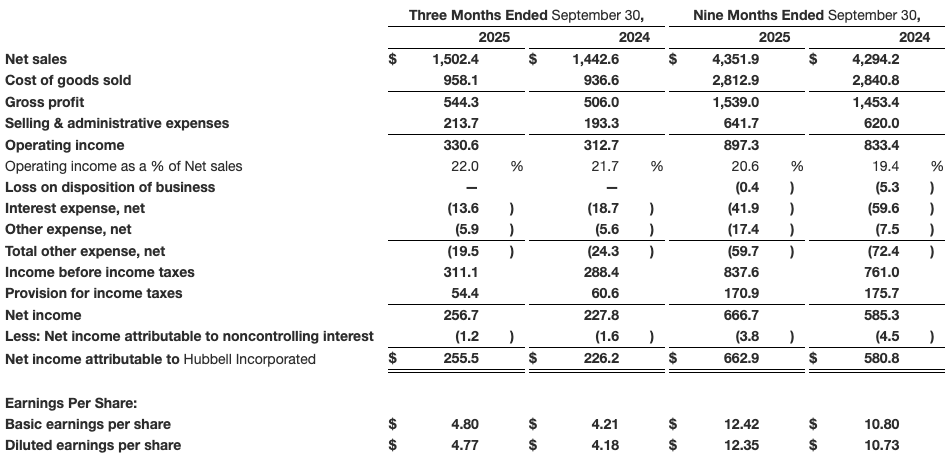
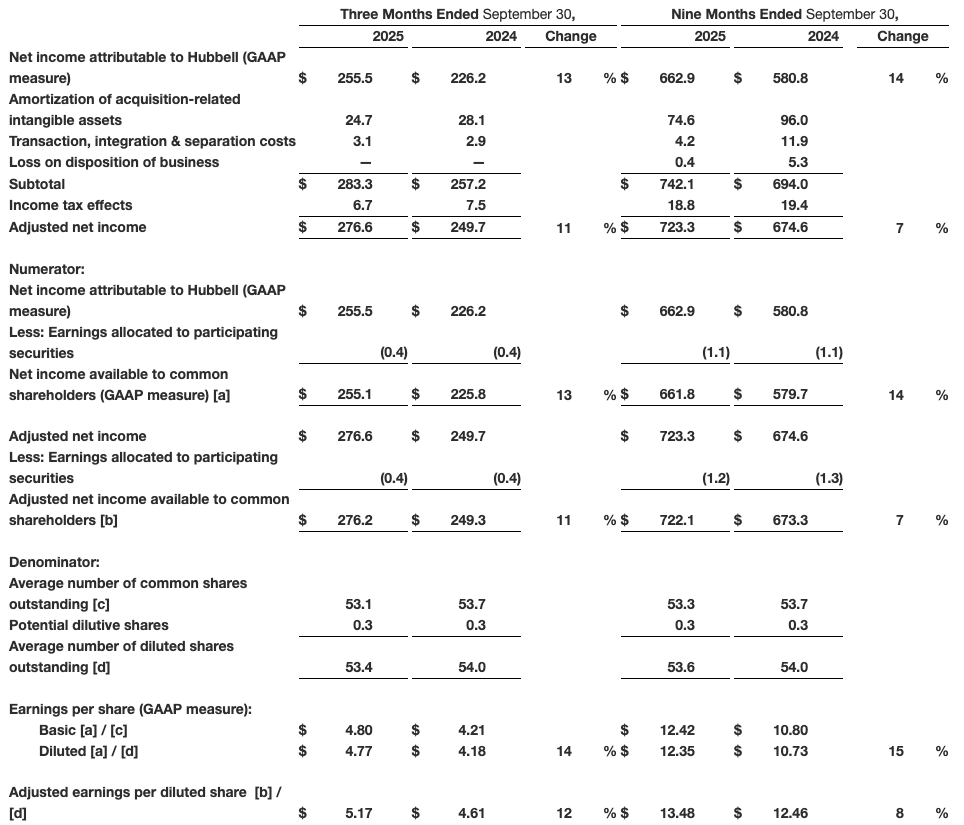
- 3Q diluted EPS of $4.77; adjusted diluted EPS of $5.17
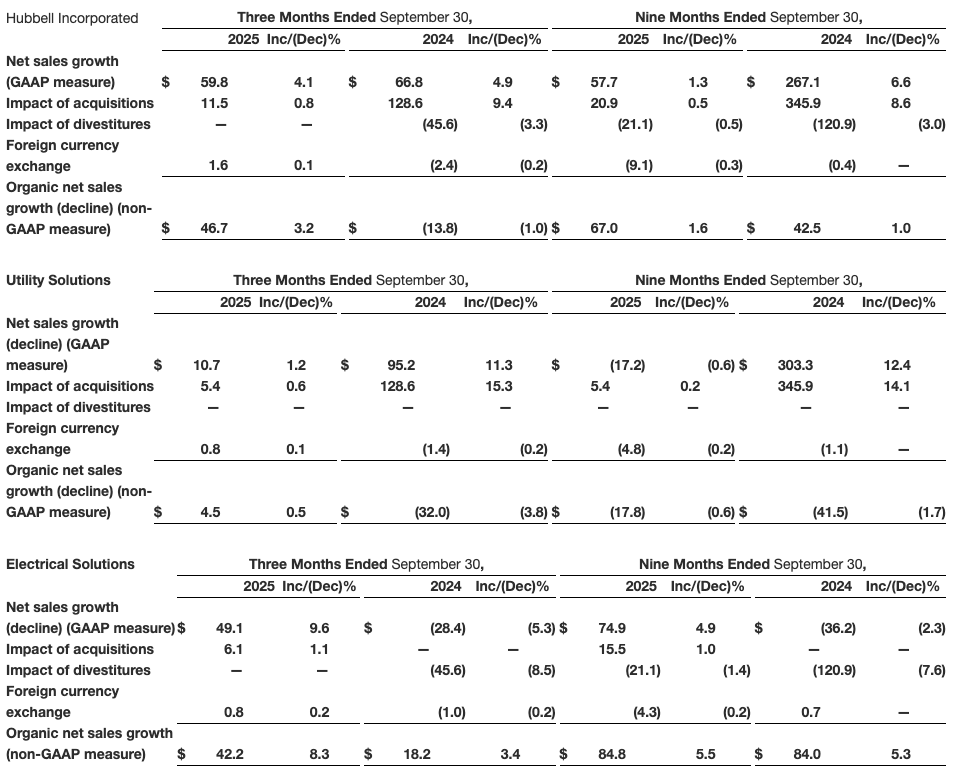
- 3Q net sales +4% (organic +3%)
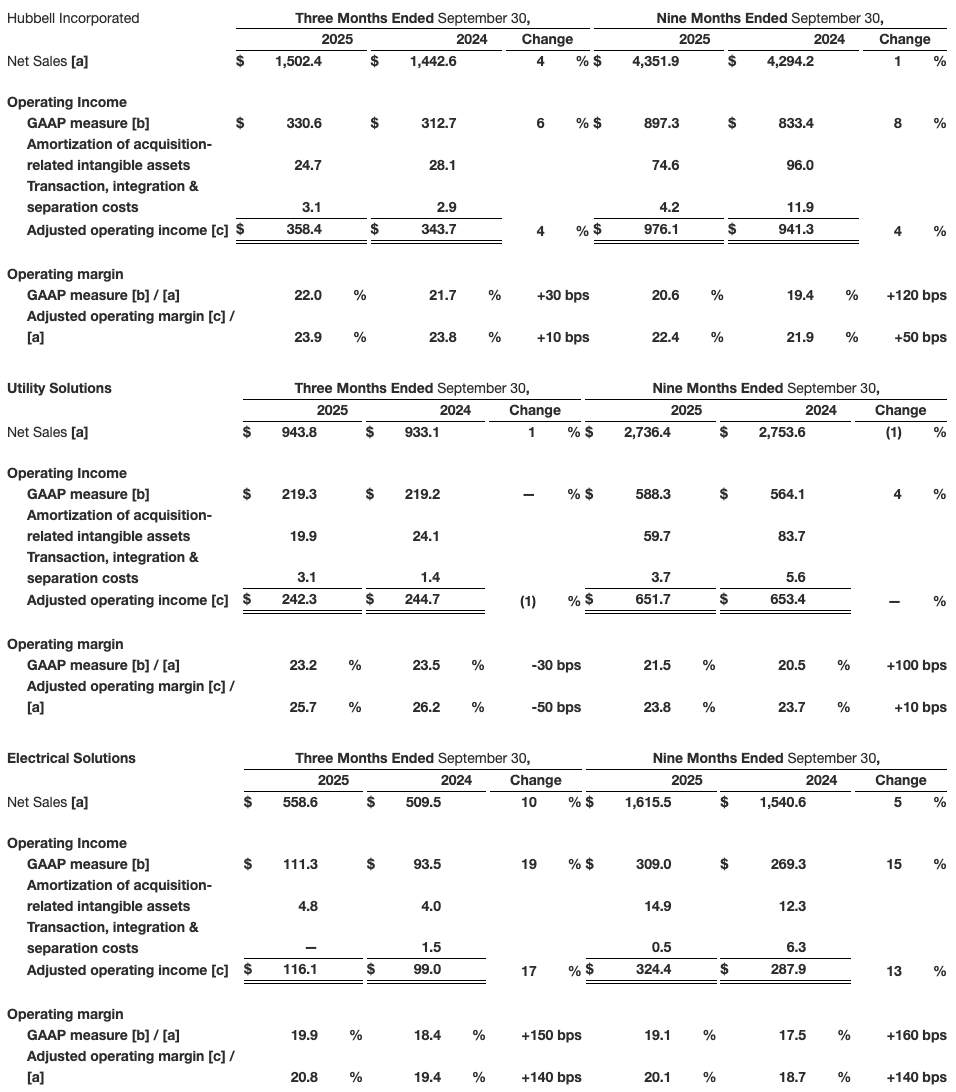
- 3Q operating margin 22.0%; adjusted operating margin 23.9%
- Raising 2025 diluted EPS outlook to $16.55-$16.75; adj. diluted EPS of $18.10-$18.30
Hubbell Incorporated (NYSE: HUBB) today reported operating results for the third quarter ended September 30, 2025.
“Hubbell delivered double digit adjusted earnings per diluted share growth in the third quarter, driven by strong organic growth in Electrical Solutions and Grid Infrastructure products within our Utility Solutions segment, as well as a lower year-over-year tax rate” said Gerben Bakker, Chairman, President and CEO.
Mr. Bakker continued, “In our Utility Solutions segment, Grid Infrastructure achieved 8% organic growth in the quarter. T&D markets remained strong as utility customers invest to interconnect new sources of load and generation on the grid, while aging infrastructure continued to drive solid hardening and resilience activity. Grid Automation sales were down 18% in the quarter, driven by weak meter and AMI project activity, while protection and controls products contributed solid growth. In Electrical Solutions, 8% organic growth was driven by strength in datacenter and light industrial markets. Execution on our segment unification strategy continues to drive growth through innovation and commercial alignment, along with operating efficiencies and margin expansion. Operationally, price and productivity exceeded cost inflation across both segments in the quarter, driven by Hubbell’s strong positions in attractive markets and execution in proactively managing our cost structure.”
Mr. Bakker concluded, “We are raising our 2025 adjusted earnings per share outlook, which anticipates 3-4% organic growth, strong adjusted operating margin expansion and a lower full year tax rate than previously anticipated.”
Certain terms used in this release, including “net debt”, “free cash flow”, “organic net sales”, “organic net sales growth”, “restructuring-related costs”, “Adjusted EBITDA”, and certain other “adjusted” measures, are defined under the section entitled “Non-GAAP Definitions.” See page 9 for more information.
THIRD QUARTER FINANCIAL HIGHLIGHTS
The comments and year-over-year comparisons in this segment review are based on third quarter results in 2025 and 2024.
Utility Solutions segment net sales in the third quarter of 2025 increased 1% to $944 million compared to $933 million reported in the third quarter of 2024. Organic net sales increased approximately 1% in the quarter. Grid Infrastructure net sales increased approximately 9% and Grid Automation net sales decreased approximately 18%. Segment operating income was $219 million, or 23.2% of net sales, in the third quarter of 2025 as compared to $219 million, or 23.5% of net sales in the same period of 2024. Segment adjusted operating income was $242 million, or 25.7% of net sales, in the third quarter of 2025 as compared to $245 million, or 26.2% of net sales in the prior year period. Changes in operating income and operating margin were primarily due to favorable price realization and productivity as well as strong volume growth in Grid Infrastructure, offset by volume declines in Grid Automation as well as higher cost inflation, raw material costs and tariffs.
Electrical Solutions segment net sales in the third quarter of 2025 increased 10% to $559 million compared to $510 million reported in the third quarter of 2024. Organic net sales increased 8% in the quarter, while an acquisition contributed 1%. Segment operating income was $111 million, or 19.9% of net sales in the third quarter of 2025, compared to $94 million, or 18.4% of net sales in the same period of 2024. Adjusted operating income was $116 million, or 20.8% of net sales, in the third quarter of 2025 as compared to $99 million, or 19.4% of net sales in the same period of the prior year. Changes in operating income and operating margin were driven primarily by volume growth and favorable price realization and productivity, partially offset by higher cost inflation, raw material costs and tariffs.
The effective tax rate in the third quarter of 2025 decreased to 17.5% as compared to 21.0% in the third quarter of 2024, primarily due to a large income tax benefit in the third quarter of 2025 from an international restructuring.
Adjusted diluted EPS in the third quarter 2025 excludes $0.35 of amortization of acquisition-related intangible assets and $0.05 of transaction, integration, and separation costs. Adjusted diluted EPS in the third quarter 2024 excluded $0.39 of amortization of acquisition-related intangible assets and $0.04 of transaction, integration, & separation costs.
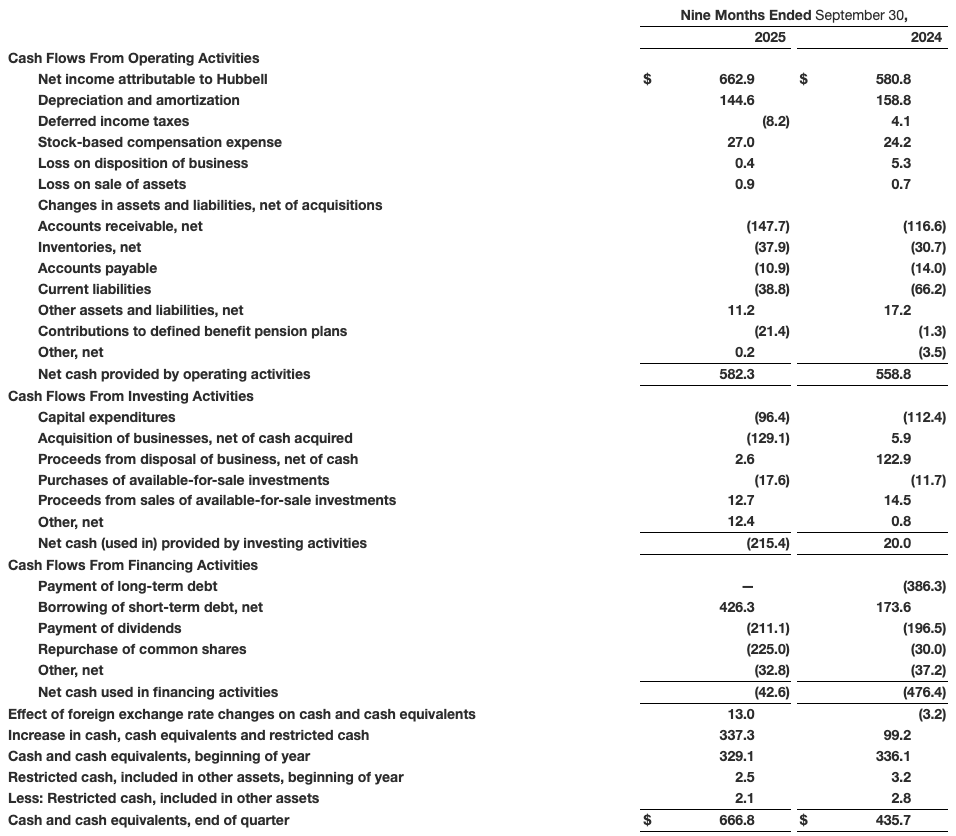
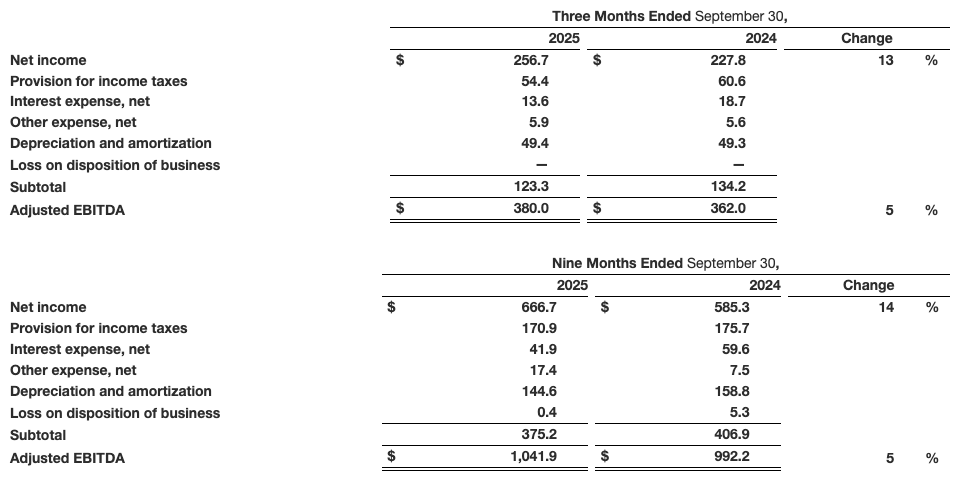
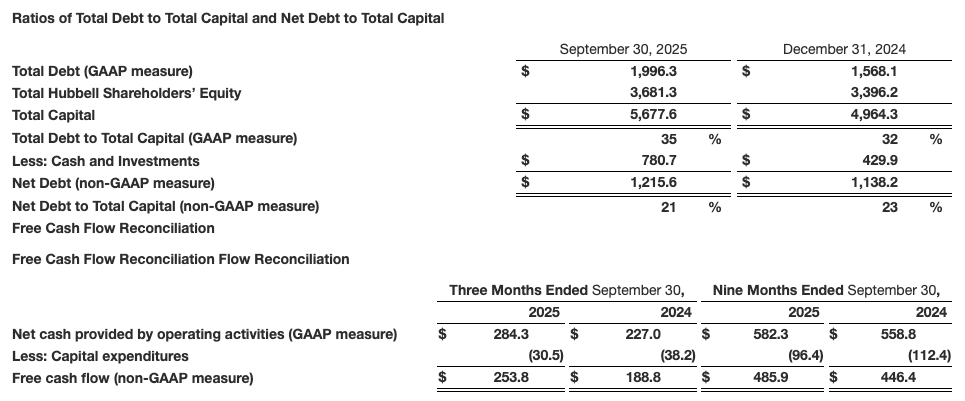
Net cash provided by operating activities was $284 million in the third quarter of 2025 versus net cash provided by operating activities of $227 million in the 2024 period. Free cash flow was $254 million in the third quarter of 2025 versus $189 million in the comparable period of 2024.
SUMMARY & OUTLOOK
For the full year 2025, Hubbell anticipates diluted earnings per share (“EPS”) in the range of $16.55-$16.75 and anticipates adjusted diluted earnings per share (“Adjusted EPS”) in the range of $18.10-$18.30. Adjusted EPS excludes amortization of acquisition-related intangible assets, which the Company expects to be approximately $1.45 per share for the full year, and approximately $0.10 of transaction, integration and separation costs. The Company believes Adjusted EPS is a useful measure of underlying performance in light of our acquisition and divestiture strategy.
Hubbell anticipates full year 2025 total sales growth and organic net sales growth of 3-4%. The diluted EPS and Adjusted EPS ranges are based on an adjusted tax rate of 20.5% to 21.0% and include approximately $20 million of anticipated restructuring and related investment. The Company expects full year 2025 free cash flow conversion of approximately 90% on adjusted net income.
CONFERENCE CALL
Hubbell will conduct an earnings conference call to discuss its third quarter 2025 financial results today, October 28, 2025 at 10:00 a.m. ET. A live audio of the conference call will be available and can be accessed by visiting Hubbell’s “Investor Relations – Events/Presentations” section of www.hubbell.com. Audio replays will also be available at the conclusion of the call by visiting www.hubbell.com and selecting “Investors” from the options at the bottom of the page and then “Events/Presentations” from the drop-down menu.
FORWARD-LOOKING STATEMENTS
Certain statements contained herein may constitute forward-looking statements within the meaning of the Private Securities Litigation Reform Act of 1995. These statements generally relate to our expectations and beliefs regarding our financial results, condition and outlook, projections of future performance, anticipated growth and end markets, changes in operating results, market conditions and economic conditions, expected capital resources, liquidity, financial performance, pension funding, results of operations, plans, strategies, opportunities, developments and productivity initiatives, competitive positioning, and trends in particular markets or industries. In addition, all statements set forth in the “Summary & Outlook” section above, as well as other statements that are not strictly historic in nature are forward-looking. These statements may be identified by the use of forward-looking words or phrases such as “believe”, “expect”, “anticipate”, “intend”, “depend”, “plan”, “estimated”, “predict”, “target”, “should”, “could”, “may”, “subject to”, “continues”, “growing”, “prospective”, “forecast”, “projected”, “purport”, “might”, “if”, “contemplate”, “potential”, “pending”, “target”, “goals”, “scheduled”, “will”, “will likely be”, and similar words and phrases. Such forward-looking statements are based on our current expectations and involve numerous assumptions, known and unknown risks, uncertainties and other factors which may cause actual and future performance or the Company’s achievements to be materially different from any future results, performance, or achievements expressed or implied by such forward-looking statements. Such factors include, but are not limited to: the effects of trade tariffs, import quotas and other trade restrictions or actions taken by the United States, Mexico, the United Kingdom, member states of the European Union, and other countries, including recent and ongoing potential changes in U.S. trade policies that may be made by the current or a future presidential administration and changes in trade policies in other countries made in response to changes in U.S. trade policies; the general impact of inflation on our business, including the impact on raw materials costs, elevated interest rates and increased energy costs and our ability to implement and maintain pricing actions that we have taken to cover higher costs and protect our margin profile; economic and business conditions in particular industries, markets or geographic regions, as well the potential macro-economic effects of the U.S. government federal deficit, and for continued inflation, a significant economic slowdown, stagflation or recession; political unrest and military actions in foreign countries, including trade tensions with China and the wars in Ukraine and the Middle East, as well as the impact on world markets and energy supplies and prices resulting therefrom; continued softness in the grid automation market of Utility Solutions and residential market of Electrical Solutions; our ability to offset increases in material and non-material costs through price recovery and volume growth; effects of unfavorable foreign currency exchange rates and the potential use of hedging instruments to hedge the exposure to fluctuating rates of foreign currency exchange on inventory purchases; the outcome of contingencies or costs compared to amounts provided for such contingencies, including those with respect to pension withdrawal liabilities; achieving sales levels to meet revenue expectations; unexpected costs or charges, certain of which may be outside the Company’s control; failure to achieve projected levels of efficiencies, cost savings and cost reduction measures, including those expected as a result of our lean initiatives and strategic sourcing plans, regulatory issues, changes in tax laws and policies, including changes in current U.S. income tax rates, multijurisdictional implementation of the Organisation for Economic Co-operation and Development’s comprehensive base erosion and profit shifting plan, or changes in geographic profit mix affecting tax rates and availability of tax incentives; the ability to successfully manage and integrate acquired businesses, including the acquisitions of Northern Star Holdings, Inc. (the Systems Control business), Alliance USAcqCo 2, Inc., a Delaware corporation (the Ventev business), Nicor, Inc. (the Nicor business), and Power Rose Acquisition, Inc. (the DMC Power business), as well as the failure to realize expected synergies and benefits anticipated when we make an acquisition due to potential adverse reactions or changes to business or employee relationships resulting from completion of the transaction, competitive responses to the transaction, the possibility that the anticipated benefits of the transaction are not realized when expected or at all, including as a result of the impact of, or problems arising from, the integration of the acquired business, diversion of management’s attention from ongoing business operations and opportunities, and litigation relating to the transaction; the impact of certain divestitures, including the benefits and costs of the sale of the residential lighting business; the ability to effectively develop and introduce new products, expand into new markets and deploy capital; and other factors described in our Securities and Exchange Commission filings, including in the “Business”, “Risk Factors”, “Management’s Discussion and Analysis of Financial Condition and Results of Operations”, “Forward-Looking Statements” and “Quantitative and Qualitative Disclosures about Market Risk” sections in the Company’s Annual Report on Form 10-K for the year ended December 31, 2024 as well as in the Company’s Quarterly Reports on Form 10-Q. Any such forward-looking statements are not guarantees of future performances and actual results, developments and business decisions may differ from those contemplated by such forward-looking statements. The Company disclaims any duty to update any forward-looking statement, all of which are expressly qualified by the foregoing, other than as required by law.
NON-GAAP DEFINITIONS
References to “adjusted” operating measures exclude the impact of certain costs, gains or losses. Management believes these adjusted operating measures provide useful information regarding our underlying performance from period to period and an understanding of our results of operations without regard to items we do not consider a component of our core operating performance. Adjusted operating measures are non-GAAP measures, and include adjusted operating income, adjusted operating margin, adjusted net income attributed to Hubbell Incorporated, adjusted net income available to common shareholders, adjusted earnings per diluted share, and Adjusted EBITDA. These non-GAAP measures exclude, where applicable:
- Amortization of all intangible assets associated with our business acquisitions, including inventory step-up amortization associated with those acquisitions. The intangible assets associated with our business acquisitions arise from the allocation of the purchase price using the acquisition method of accounting in accordance with Accounting Standards Codification 805, “Business Combinations.” These assets consist primarily of customer relationships, developed technology, trademarks and tradenames, and patents, as reported in Note 7—Goodwill and Other Intangible Assets, under the heading “Total Definite-Lived Intangibles,” within the Company’s audited consolidated financial statements set forth in its Annual Report on Form 10-K for Fiscal Year Ended December 31, 2024. The Company excludes these non-cash expenses because we believe it (i) enhances management’s and investors’ ability to analyze underlying business performance, (ii) facilitates comparisons of our financial results over multiple periods, and (iii) provides more relevant comparisons of our results with the results of other companies as the amortization expense associated with these assets may fluctuate significantly from period to period based on the timing, size, nature, and number of acquisitions. Although we exclude amortization of these acquired intangible assets and inventory step-up from our non-GAAP results, we believe that it is important for investors to understand that revenue generated, in part, from such intangibles is included within revenue in determining adjusted net income attributable to Hubbell Incorporated.
- Transaction, integration, and separation costs associated with our business acquisitions and divestitures. The effect that acquisitions and divestitures may have on our results fluctuate significantly based on the timing, size, and number of transactions, and therefore results in significant volatility in the costs to complete transactions and integrate or separate the businesses. Transaction costs are primarily professional services and other fees incurred to complete the transactions. Integration and separation costs are the internal and external incremental costs directly relating to these activities for the acquired or divested business. The acquisition and integration of DMC Power will result in significant transaction and integration costs, and the acquisitions and dispositions completed by the company in the fourth quarter of 2023 resulted in a significant increase in the transaction, integration and separation costs. As a result, we believe excluding such costs relating to these transactions provides useful and more comparable information for investors to better assess our operating performance from period to period.
- Gains or losses from the disposition of a business. The Company excludes these gains or losses because we believe it enhances management’s and investors’ ability to analyze underlying business performance and facilitates comparisons of our financial results over multiple periods. In the first quarter of 2024 the Company recognized a $5.3 million pre-tax loss on the disposition of the residential lighting business. In the second quarter of 2025 the Company recognized a $0.4 million pre-tax loss on the disposition of a product line in the HES segment.
- The income tax effect directly related to the disposition of the residential lighting business. In the first quarter of 2024 the Company recognized $6.8 million of income tax expense on the sale of the residential lighting business, primarily driven by differences between book and tax basis in goodwill.
- Income tax effects of the above adjustments, which are calculated using the statutory tax rate, taking into consideration the nature of the item and the relevant taxing jurisdiction, unless otherwise noted.
Adjusted EBITDA is a non-GAAP measure that excludes the items noted above and also excludes the Other income (expense), net, Interest expense, net, and Provision for income taxes captions of the Condensed Consolidated Statement of Income, as well as depreciation and amortization expense.
Net debt (defined as total debt less cash and investments) to total capital is a non-GAAP measure that we believe is a useful measure for evaluating the Company’s financial leverage and the ability to meet its funding needs.
Free cash flow is a non-GAAP measure that we believe provides useful information regarding the Company’s ability to generate cash without reliance on external financing. In addition, management uses free cash flow to evaluate the resources available for investments in the business, strategic acquisitions and further strengthening the balance sheet.
In connection with our restructuring and related actions, we have incurred restructuring costs as defined by U.S. GAAP, which are primarily severance and employee benefits, asset impairments, accelerated depreciation, as well as facility closure, contract termination and certain pension costs that are directly related to restructuring actions. We also incur restructuring-related costs, which are costs associated with our business transformation initiatives, including the consolidation of back-office functions and streamlining our processes, and certain other costs and gains associated with restructuring actions. We refer to these costs on a combined basis as “restructuring and related costs”, which is a non-GAAP measure.
Organic net sales, a non-GAAP measure, represents net sales according to U.S. GAAP, less net sales from acquisitions and divestitures during the first twelve months of ownership or divestiture, respectively, less the effect of fluctuations in net sales from foreign currency exchange. The period-over-period effect of fluctuations in net sales from foreign currency exchange is calculated as the difference between local currency net sales of the prior period translated at the current period exchange rate as compared to the same local currency net sales translated at the prior period exchange rate. We believe this measure provides management and investors with a more complete understanding of underlying operating results and trends of established, ongoing operations by excluding the effect of acquisitions, dispositions and foreign currency, as these activities can obscure underlying trends. When comparing net sales growth between periods excluding the effects of acquisitions, business dispositions and currency exchange rates, those effects are different when comparing results for different periods. For example, because net sales from acquisitions are considered inorganic from the date we complete an acquisition through the end of the first year following the acquisition, net sales from such acquisition are reflected as organic net sales thereafter.
There are limitations to the use of non-GAAP measures. Non-GAAP measures do not present complete financial results. We compensate for this limitation by providing a reconciliation between our non-GAAP financial measures and the respective most directly comparable financial measure calculated and presented in accordance with GAAP. Because non-GAAP financial measures are not standardized, it may not be possible to compare these financial measures with other companies’ non-GAAP financial measures having the same or similar names. These financial measures should not be considered in isolation from, as substitutes for, or alternative measures of, reported GAAP financial results, and should be viewed in conjunction with the most comparable GAAP financial measures and the provided reconciliations thereto. We believe, however, that these non-GAAP financial measures, when viewed together with our GAAP results and related reconciliations, provide a more complete understanding of our business. We strongly encourage investors to review our consolidated financial statements and publicly filed reports in their entirety and not rely on any single financial measure.
Reconciliations of each of these non-GAAP measures to the most directly comparable GAAP measure can be found in the tables below. When we provide our expectations for organic net sales, adjusted effective tax rate, adjusted diluted EPS and free cash flow on a forward-looking basis, a reconciliation of the differences between the non-GAAP expectations and the corresponding GAAP measures (expected net sales, effective tax rate, diluted EPS and net cash flows provided by operating activities) generally is not available without unreasonable effort due to potentially high variability, complexity and low visibility as to the items that would be excluded from the GAAP measure in the relevant future period, such as unusual gains and losses, fluctuations in foreign currency exchange rates, the impact and timing of potential acquisitions and divestitures, certain financing costs, and other structural changes or their probable significance. The variability of the excluded items may have a significant, and potentially unpredictable, impact on our future GAAP results.
HUBBELL INCORPORATED
Condensed Consolidated Statement of Income
(unaudited)
(in millions, except per share amounts)
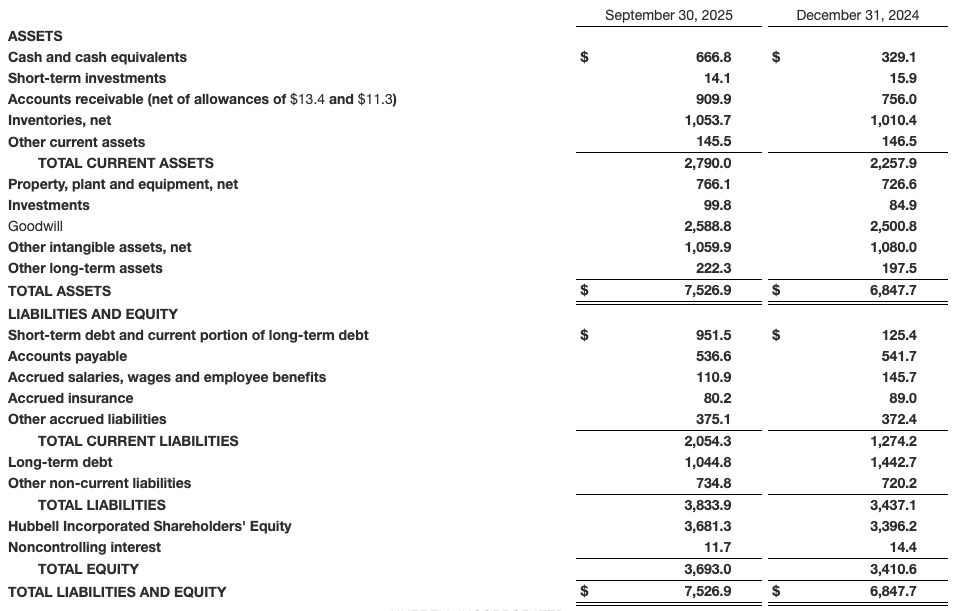
HUBBELL INCORPORATED
Condensed Consolidated Balance Sheet
(unaudited)
(in millions)
HUBBELL INCORPORATED
Condensed Consolidated Statement of Cash Flows
(unaudited)
(in millions)
HUBBELL INCORPORATED
Earnings Per Share
(unaudited)
(in millions, except per share amounts)
HUBBELL INCORPORATED
Segment Information
(unaudited)
(in millions)
HUBBELL INCORPORATED
Organic Net Sales Growth
(unaudited)
(in millions and percentage change)
HUBBELL INCORPORATED
Adjusted EBITDA
(unaudited)
(in millions)
HUBBELL INCORPORATED
Restructuring and Related Costs Included in Consolidated Results
(unaudited)
(in millions, except per share amounts)
HUBBELL INCORPORATED
Additional Non-GAAP Financial Measures
(unaudited)
(in millions)
SourceHubbell
EMR Analysis
More information on Hubbell Inc.: See the full profile on EMR Executive Services
More information on Gerben W. Bakker (Chairman, President and Chief Executive Officer, Hubbell Inc.): See the full profile on EMR Executive Services
More information on William R. Sperry (Executive Vice President and Chief Financial Officer, HUBBELL till December 31, 2025 + Executive Vice President, HUBBELL as from 2026): See the full profile on EMR Executive Services
More information on Joseph Capozzoli (Vice President, Finance, HES – Electrical Solutions Segment, HUBBELL till December 31, 2025 + Senior Vice President and Chief Financial Officer, HUBBELL as from January 1, 2026): See the full profile on EMR Executive Services
More information on DMC Power by Hubbell Inc.: https://dmcpower.com/ + DMC Power designs and manufactures the highest quality connection systems for transmission, distribution, substation, and industrial projects. The company’s Swage system, comprised of custom designed Power Connectors and a patented 360° Radial Swage Tool, has helped utilities around the world finish their projects with just the push of a button.
DMC Power was created with a vision to revolutionize the Electrical Utility industry with our 360° Swage Connection System.
Fast forward to today and our cutting-edge designs, local engineering experience, direct sales specialists and US-based manufacturing capabilities have propelled DMC Power connectors as the preferred choice for Utilities across North America.
The evolution of DMC Power has expanded our portfolio from the energy sector and utility industry, where we serve all segments of the transmission and distribution market, to renewable energy (wind and solar farms), large scale grounding projects, railways, mining projects and various large scale industrial projects where connections are critical.
At DMC Power, our mission is simple yet powerful: to provide exceptional Swage Connection System solutions that enable industries worldwide.
With over 350 employees and two manufacturing facilities in Carson, CA and Olive Branch, MS, along with multiple distribution facilities located across North America, DMC Power anticipates 2026 revenue of approximately $130 million and EBITDA of approximately $60 million.
More information on Anthony Ward (Chief Executive Officer, DMC Power, Hubbell Inc.): See the full profile on EMR Executive Services
EMR Additional Financial Notes:
- Major financial KPI’s since 2017 are available on EMR Executive Services under “Financial Results” and comparison with peers under “Market Positioning”
- Companies’ full profile on EMR Executive Services are based on their official press releases, quarterly financial reports, annual reports and other official documents.
- All members of the Executive Committee and of the Board have their full profile on EMR Executive Services
- The HUBBELL Third Quarter 2025 Earning Call Presentation can be viewed here: https://hubbell.gcs-web.com/static-files/c05025d1-a247-49ff-84ff-ba681f830ca4
- The HUBBELL Second Quarter 2025 Earning Call Presentation can be viewed here: https://hubbell.gcs-web.com/static-files/75b8b2f6-166a-422a-80f6-a91b53ae460d
- The HUBBELL 2024 Annual Report can be viewed here: https://investor.hubbell.com/ar2024/images/Hubbell_AR2024.pdf
- The HUBBELL Fourth Quarter 2024 Earning Call Presentation can be viewed here: https://hubbell.gcs-web.com/static-files/b1f62cad-84d7-4b15-9a39-fcf5ecef4fa3
- The HUBBELL 2024 Investor Day Presentation can be viewed here: https://hubbell.gcs-web.com/static-files/6c9fb452-07f6-4405-8bf9-fd956d9dc270
- The HUBBELL 2023 Annual Report can be viewed here: https://hubbell.gcs-web.com/static-files/ad58e3d6-bfb4-4a7b-b8e2-995a7b1c75d8
- The HUBBELL 2023 Q4 Earning Call Presentation can be viewed here: https://hubbell.gcs-web.com/static-files/ee0bd70b-e4a3-4887-a0d9-ee52af51617f
- The HUBBELL 2022 Q4 Earning Call Presentation can be viewed here: https://hubbell.gcs-web.com/static-files/49cebd52-c41d-4897-958c-e891d10d4a70
- The HUBBELL 2022 Investor Day Presentation can be viewed here: https://hubbell.gcs-web.com/static-files/34988d2d-4a83-4297-84fa-99544097bf0b
- The HUBBELL 2022 Annual Report can be viewed here: https://investor.hubbell.com/ar2022/images/Hubbell_AR2022.pdf
- The HUBBELL 2021 Annual Report can be viewed here: https://investor.hubbell.com/ar2021/images/Hubbell_AR2021.pdf