Acuity – Acuity reports fiscal 2026 second-quarter results


Strong Execution Delivers Sales Growth, Margin Expansion and EPS Improvement
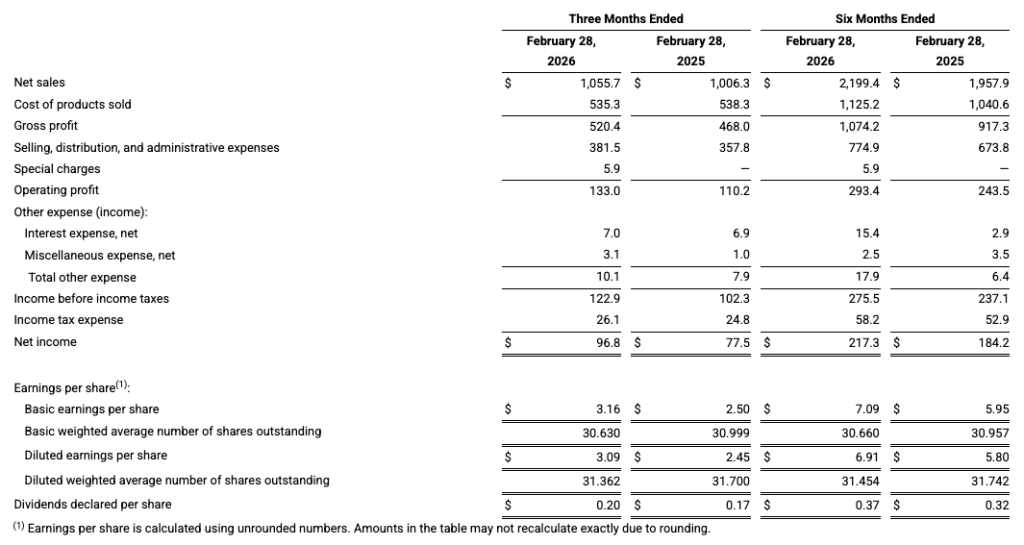
- Delivered Net Sales of $1.1B, an Increase of 5% Compared to the Prior Year
- Delivered Operating Profit of $133M, Up 21% Compared to the Prior Year; Grew Adjusted Operating Profit to $176M, Up 8% Compared to the Prior Year
- Delivered Diluted EPS of $3.09, Up 26% Compared to the Prior Year; Grew Adjusted Diluted EPS to $4.14, Up 11% Compared to the Prior Year
ATLANTA, April 02, 2026 (GLOBE NEWSWIRE) — Acuity Inc. (NYSE: AYI), (“Acuity”), a market-leading industrial technology company, delivered net sales of $1.1 billion in the second quarter, ended February 28, 2026, an increase of $49.4 million, or 4.9 percent, compared to the prior year.
“We demonstrated strong execution in our second quarter of fiscal 2026,” stated Neil Ashe, Chairman, President and Chief Executive Officer of Acuity Inc. “We grew net sales, we expanded our adjusted operating profit and adjusted operating profit margin, and we increased our adjusted diluted earnings per share. We generated strong cash flow and allocated capital effectively.”
During the second quarter of fiscal 2026 we took certain actions related to productivity improvements in our ABL segment that resulted in $6 million of special charges. These charges primarily related to labor cost reductions.
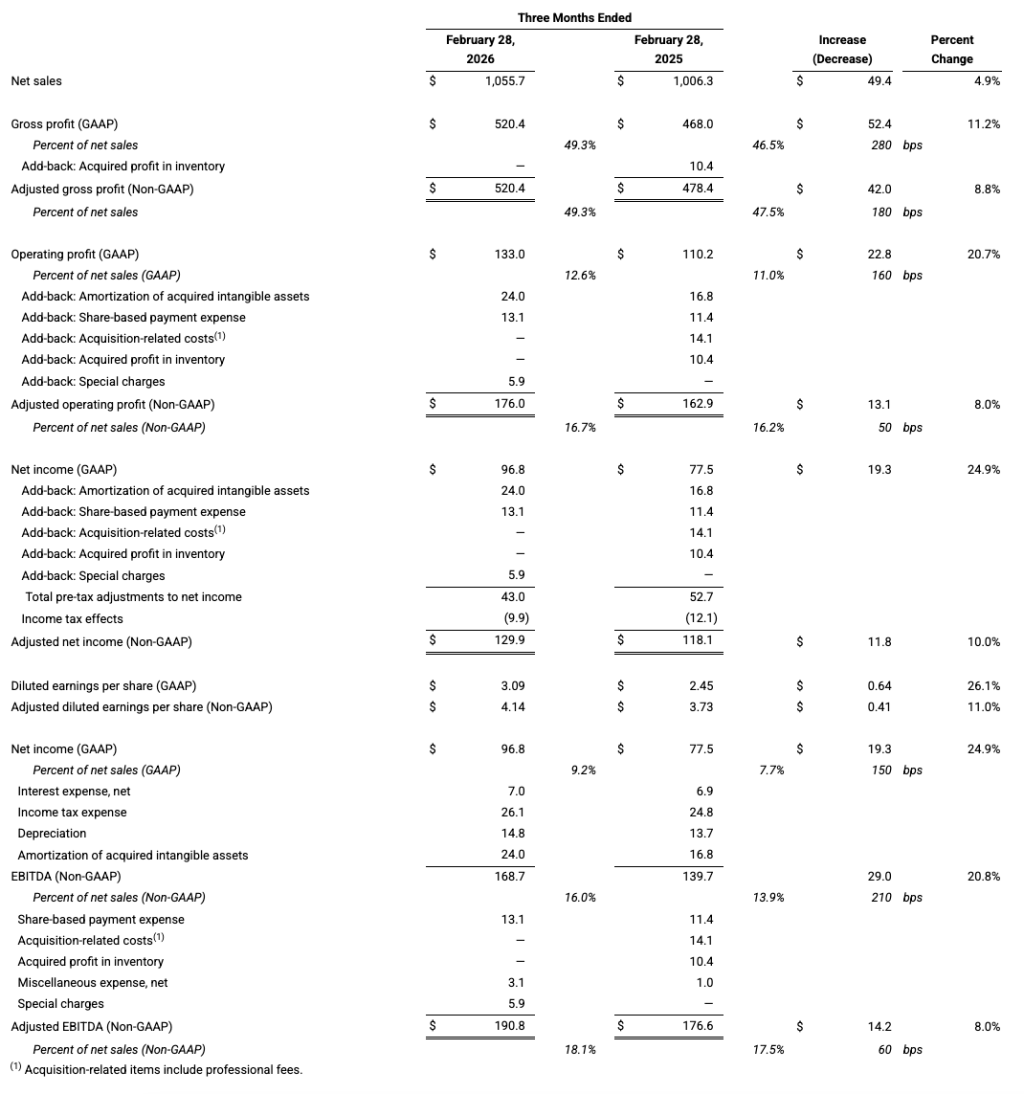
Operating profit was $133.0 million in the second quarter of fiscal 2026, an increase of $22.8 million, or 20.7 percent, compared to the prior year. Operating profit as a percent of net sales was 12.6 percent in the second quarter of fiscal 2026, an increase of 160 basis points compared to the prior year. Adjusted operating profit was $176.0 million in the second quarter of fiscal 2026, an increase of $13.1 million, or 8.0 percent, compared to the prior year. Adjusted operating profit as a percent of net sales was 16.7 percent in the second quarter of fiscal 2026, an increase of 50 basis points compared to the prior year.
Diluted earnings per share was $3.09 in the second quarter of fiscal 2026, an increase of $0.64, or 26.1 percent, compared to the prior year. Adjusted diluted earnings per share was $4.14 in the second quarter of fiscal 2026, an increase of $0.41, or 11.0 percent.
Segment Performance
Acuity Brands Lighting (“ABL”)
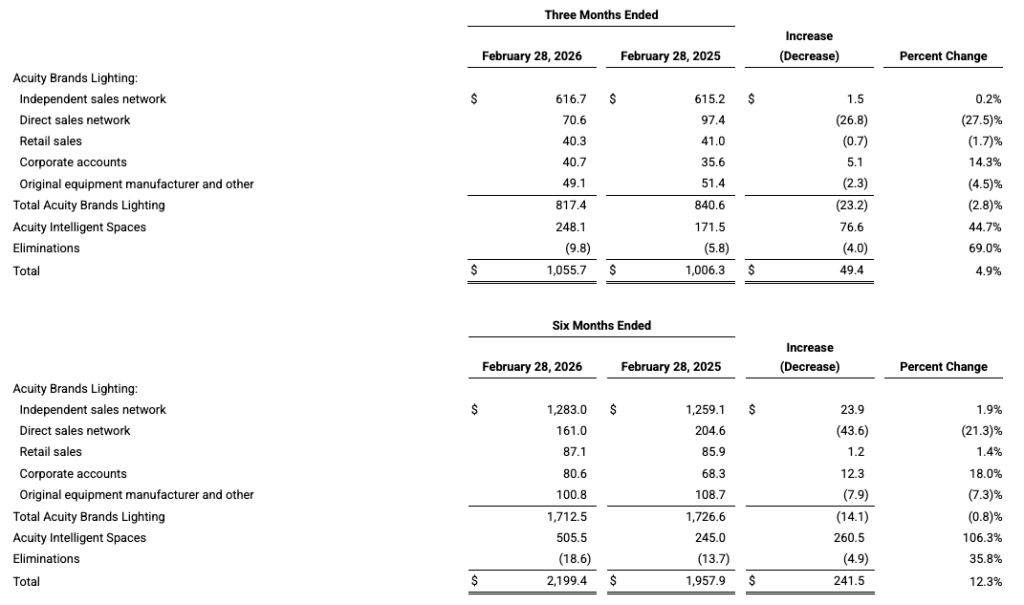
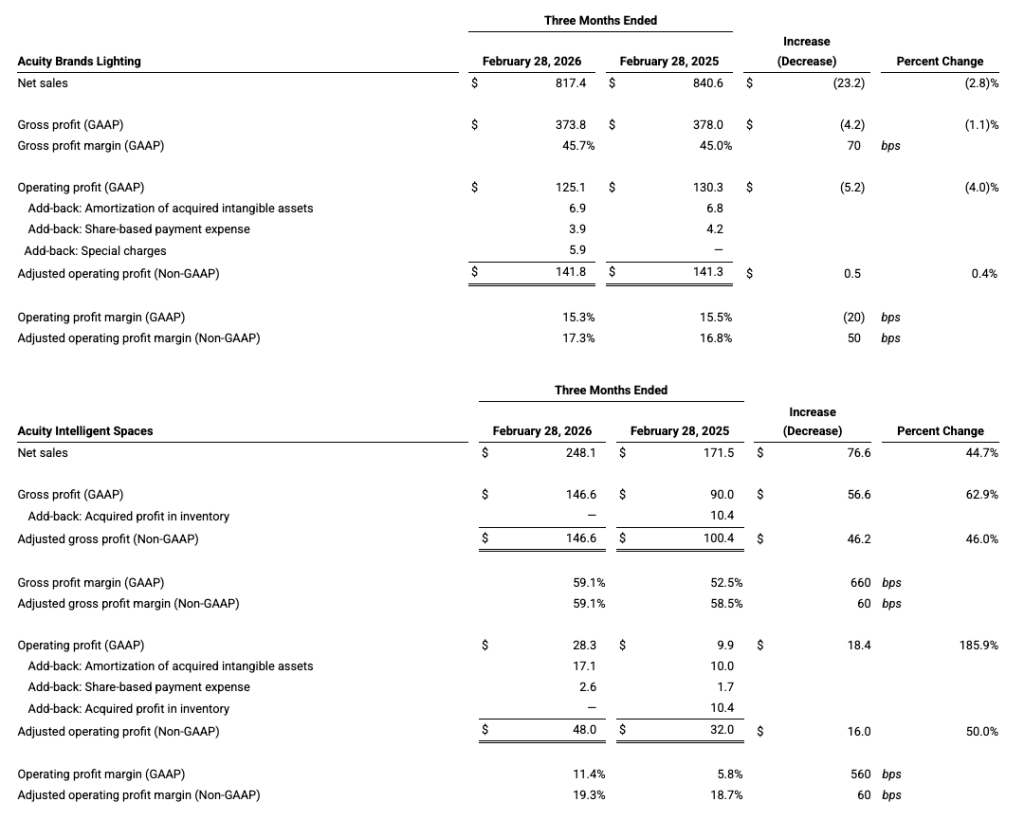
ABL generated net sales of $817.4 million in the second quarter of fiscal 2026, a decrease of $23.2 million, or 2.8 percent, compared to the prior year.
Operating profit was $125.1 million in the second quarter of fiscal 2026, a decrease of $5.2 million, or 4.0 percent, compared to the prior year. Operating profit as a percent of ABL net sales was 15.3 percent in the second quarter of fiscal 2026, a decrease of 20 basis points compared to the prior year. Adjusted operating profit was $141.8 million in the second quarter of fiscal 2026, an increase of $0.5 million, or 0.4 percent, compared to the prior year. Adjusted operating profit as a percent of ABL net sales was 17.3 percent in the second quarter of fiscal 2026, an increase of 50 basis points compared to the prior year.
Acuity Intelligent Spaces (“AIS”)
AIS generated net sales of $248.1 million in the second quarter of fiscal 2026, an increase of $76.6 million, compared to the prior year. Included in fiscal 2026 net sales is an additional one month of QSC performance.
Operating profit was $28.3 million in the second quarter of fiscal 2026, an increase of $18.4 million compared to the prior year. Operating profit as a percent of AIS net sales was 11.4 percent in the second quarter of fiscal 2026, an increase of 560 basis points compared to the prior year. Adjusted operating profit was $48.0 million in the second quarter of fiscal 2026, an increase of $16.0 million compared to the prior year. Adjusted operating profit as a percent of AIS net sales was 19.3 percent in the second quarter of fiscal 2026, an increase of 60 basis points compared to the prior year.
Cash Flow and Capital Allocation
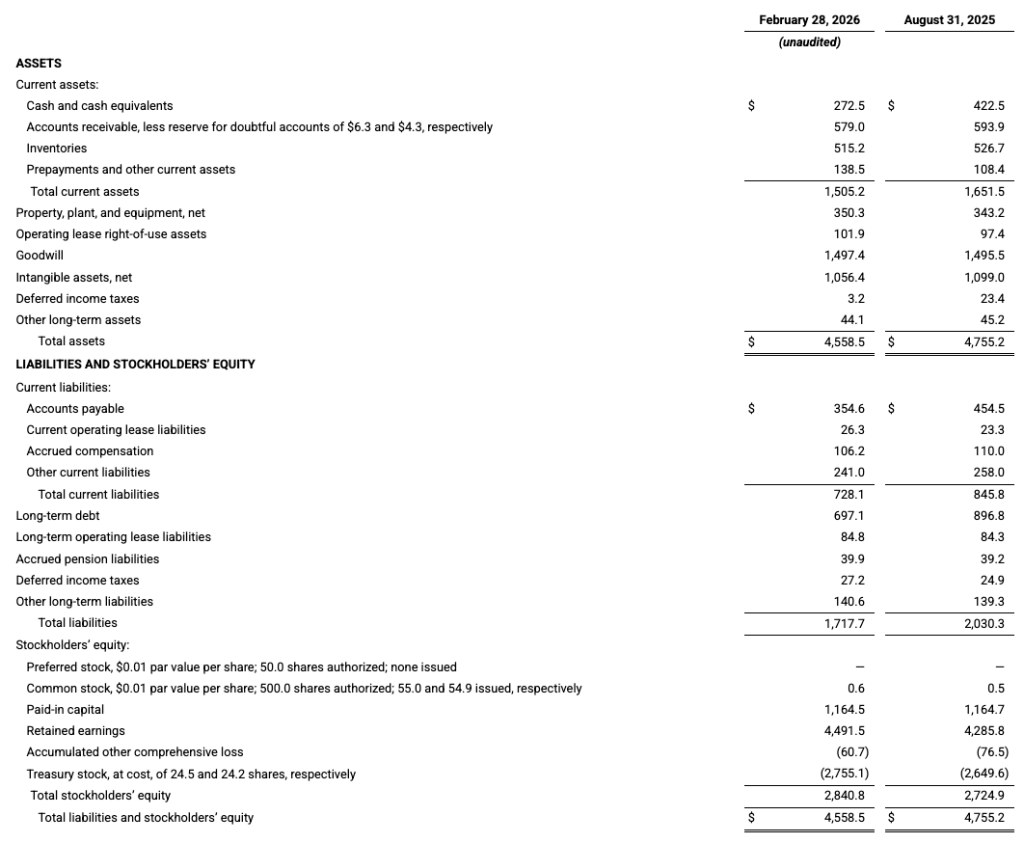
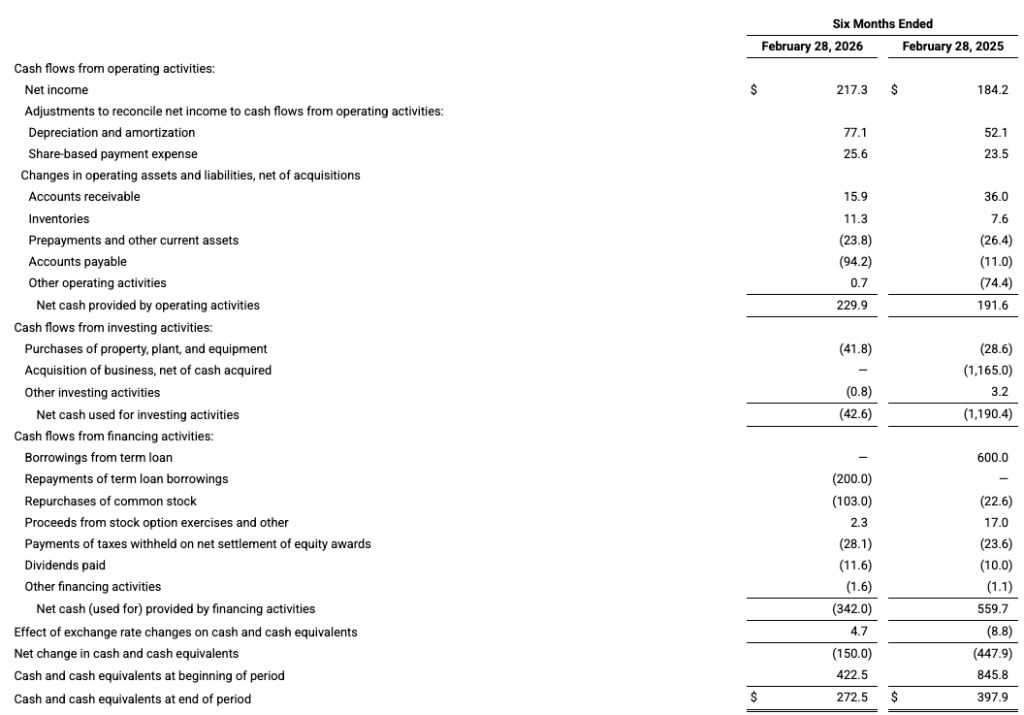
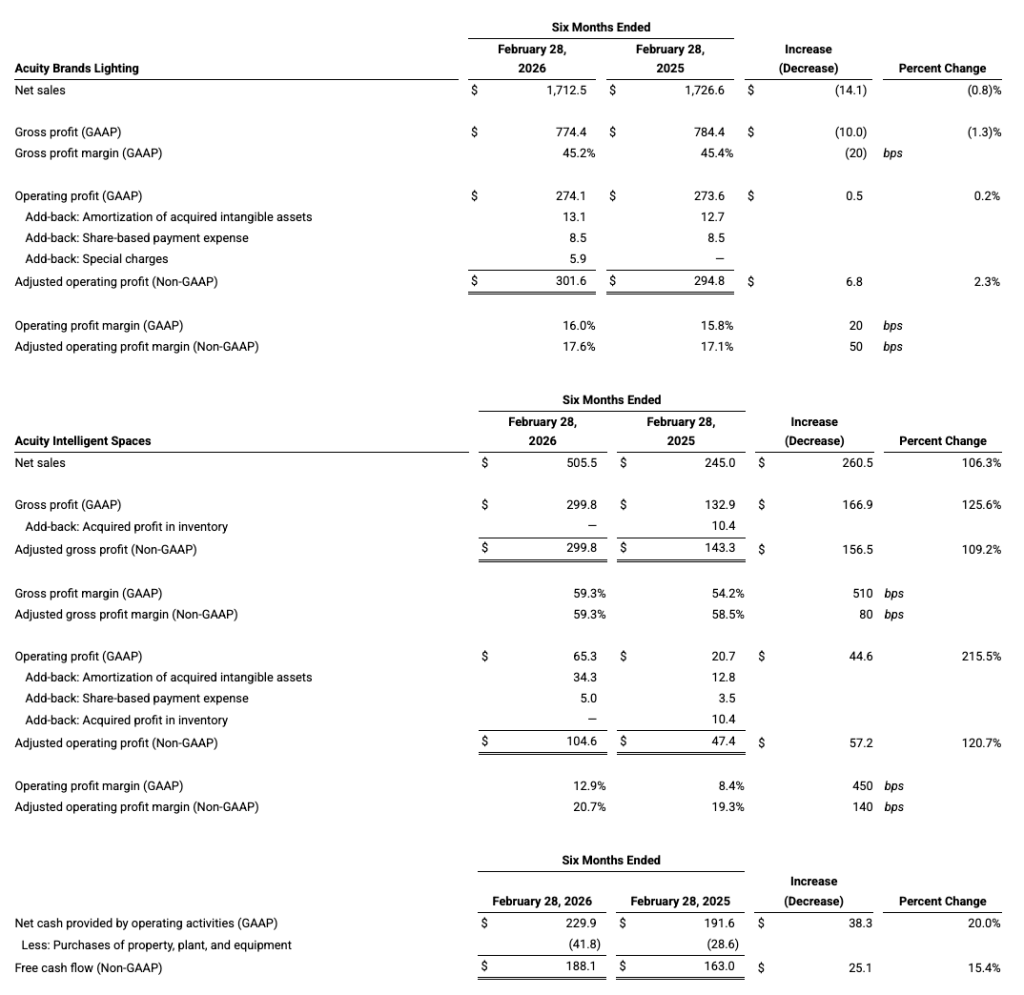
Net cash from operating activities was $229.9 million for the first six months of fiscal 2026. We increased our quarterly dividend by 18 percent to 20 cents per share, and year to date we repurchased approximately 318,000 shares of common stock for a total of $106 million.
Call Details
We will host a conference call at 8:00 a.m. ET today, Thursday, April 2, 2026. Neil Ashe, Chief Executive Officer of Acuity Inc. will lead the call. The conference call and earnings release can be accessed via our Investor Relations section of our website at www.investors.acuityinc.com. A replay of the call will also be posted to the Investor Relations website within two hours of the completion of the conference call and will be available on the website for a limited time.
Non-GAAP Financial Measures
This news release includes the following non-generally accepted accounting principles (“GAAP”) financial measures: “adjusted gross profit”, “adjusted gross profit margin”, “adjusted operating profit” and “adjusted operating profit margin” for total company and by segment; for total company only we additionally include: “adjusted net income;” “adjusted diluted EPS;” “earnings before interest, taxes, depreciation and amortization (“EBITDA”);” “EBITDA margin;” “adjusted EBITDA;” and “adjusted EBITDA margin”. These non-GAAP financial measures are provided to enhance the reader’s overall understanding of our current financial performance and prospects for the future. Specifically, management believes that these non-GAAP measures provide useful information to investors by excluding or adjusting items for amortization of acquired intangible assets, share-based payment expense, acquired profit in inventory, acquisition-related items, and special charges.
We also provide “free cash flow” (“FCF”) to enhance the reader’s understanding of our ability to generate additional cash from its business.
Management typically adjusts for these items for internal reviews of performance and uses the above non-GAAP measures for baseline comparative operational analysis, decision making and other activities. Management believes these non-GAAP measures provide greater comparability and enhanced visibility into our results of operations as well as comparability with many of its peers, especially those companies focused more on technology and software. Non-GAAP financial measures included in this news release should be considered in addition to, and not as a substitute for or superior to, results prepared in accordance with GAAP.
The most directly comparable GAAP measures for adjusted gross profit and adjusted gross profit margin for total company are “gross profit” and “gross profit margin,” respectively, which include the impact of acquired profit in inventory. Adjusted gross profit margin is adjusted gross profit divided by net sales for total company and by segment. The most directly comparable GAAP measures for adjusted operating profit and adjusted operating profit margin for total company and by segment are “operating profit” and “operating profit margin,” respectively, which include the impact of amortization of acquired intangible assets, share-based payment expense, acquired profit in inventory, acquisition-related costs, and special charges. Adjusted operating profit margin is adjusted operating profit divided by net sales for total company and by segment. The most directly comparable GAAP measures for adjusted net income and adjusted diluted EPS are “net income” and “diluted EPS,” respectively, which include the impact of amortization of acquired intangible assets, share-based payment expense, acquired profit in inventory, acquisition-related costs, and special charges. Adjusted diluted EPS is adjusted net income divided by diluted weighted average shares outstanding. The most directly comparable GAAP measure for EBITDA is “net income”, which includes the impact of net interest expense, income taxes, depreciation and amortization of acquired intangible assets. EBITDA margin is EBITDA divided by net sales for total company. The most directly comparable GAAP measure for adjusted EBITDA is “net income”, which includes the impact of net interest expense, income taxes, depreciation, amortization of acquired intangible assets, share-based payment expense, acquired profit in inventory, acquisition-related items, special charges, and miscellaneous (income) expense, net. Adjusted EBITDA margin is adjusted EBITDA divided by net sales for total company. A reconciliation of each measure to the most directly comparable GAAP measure is available in this news release.
We define FCF as net cash provided by operating activities less purchases of property, plant and equipment. A calculation of this measure is available in this news release.
Our non-GAAP financial measures may not be comparable to similarly titled non-GAAP financial measures used by other companies, have limitations as an analytical tool, and should not be considered in isolation or as a substitute for GAAP financial measures. Our presentation of such measures, which may include adjustments to exclude unusual or non-recurring items, should not be construed as an inference that our future results will be unaffected by other unusual or non-recurring items.
Forward-Looking Information
This press release contains “forward-looking statements” within the meaning of Section 27A of the Securities Act of 1933, as amended, and Section 21E of the Securities Exchange Act of 1934, as amended, pursuant to the safe harbor provisions of the Private Securities Litigation Reform Act of 1995 (the “Act”). Forward-looking statements include, but are not limited to, statements that describe or relate to our plans, initiatives, projections, vision, goals, targets, commitments, expectations, objectives, prospects, strategies, or financial outlook, and the assumptions underlying or relating thereto. In some cases, we may use words such as “expect,” “believe,” “intend,” “anticipate,” “estimate,” “forecast,” “indicate,” “project,” “predict,” “plan,” “may,” “will,” “could,” “should,” “would,” “potential,” and words of similar meaning, as well as other words or expressions referencing future events, conditions, or circumstances, to identify forward-looking statements. We intend these forward-looking statements to be covered by the safe harbor provisions for forward-looking statements contained in the Act. Forward-looking statements are not guarantees of future performance. Our forward-looking statements are based on our current beliefs, expectations, and assumptions, which may not prove to be accurate, and are subject to known and unknown risks and uncertainties, assumptions, and other important factors, many of which are outside of our control and any of which could cause our actual results to differ materially from those expressed or implied by the forward-looking statements. These risks and uncertainties are discussed in our filings with the U.S. Securities and Exchange Commission, including our most recent annual report on Form 10-K (including, but not limited to, the sections titled “Risk Factors” and “Management’s Discussion and Analysis of Financial Condition and Results of Operations”), quarterly reports on Form 10-Q, and current reports on Form 8-K. Any forward-looking statement speaks only as of the date on which it is made. This press release is not comprehensive, and for that reason, should be read in conjunction with such filings. You are cautioned not to place undue reliance on any forward-looking statements. Except as required by law, we undertake no obligation to publicly update or release any revisions to these forward-looking statements to reflect any events or circumstances after the date of this press release or to reflect the occurrence of unanticipated events, whether as a result of new information, future events, or otherwise.
ACUITY INC.
CONDENSED CONSOLIDATED BALANCE SHEETS
(In millions, except per-share data)
ACUITY INC.
CONDENSED CONSOLIDATED STATEMENTS OF INCOME (Unaudited)
(In millions, except per-share data)
ACUITY INC.
CONDENSED CONSOLIDATED STATEMENTS OF CASH FLOWS (Unaudited)
(In millions)
ACUITY INC.
DISAGGREGATED NET SALES
(In millions)
The following tables show net sales by channel for the periods presented:
ACUITY INC.
Reconciliation of Non-U.S. GAAP Measures
The tables below reconcile certain GAAP financial measures to the corresponding non-GAAP measures for total Company as well as our reportable operating segments (in millions except per share data):
SourceAcuity
EMR Analysis
More information on Acuity Inc.: See the full profile on EMR Executive Services
More information on Neil Ashe (Chairman, President and Chief Executive Officer, Acuity Inc.): See the full profile on EMR Executive Services
More information on Karen J. Holcom (Senior Vice President and Chief Financial Officer, Acuity Inc.): See the full profile on EMR Executive Services
EMR Additional Financial Notes:
- Major financial KPI’s since 2017 are available on EMR Executive Services under “Financial Results” and comparison with peers under “Market Positioning”
- Companies’ full profile on EMR Executive Services are based on their official press releases, quarterly financial reports, annual reports and other official documents like the Universal Registration Document.
- All members of the Executive Committee and of the Board have their full profile on EMR Executive Services
- The Acuity Second Quarter 2026 Results Presentation Presentation can be found here: https://investors.acuityinc.com/static-files/b49aa1fe-fed1-44c6-92f0-f169c79895b7
- The Acuity Second Quarter 2026 Infographic can be found here: https://investors.acuityinc.com/static-files/bf584d32-7c53-4a1e-932c-58e545b51dd7
- The Acuity First Quarter 2026 Results Presentation Presentation can be found here: https://investors.acuityinc.com/static-files/4c9ea653-2ae7-4630-a829-2fc089416334
- The Acuity First Quarter 2026 Infographic can be found here: https://investors.acuityinc.com/static-files/d2e316a8-ee42-48da-8f9e-37e4b759e8f0
- The Acuity 2025 Annual Report (Form 10-K) can be found here: Not yet available
- The Acuity Fourth Quarter 2025 and Full Year 2025 Results Presentation Presentation can be found here: https://investors.acuityinc.com/static-files/25e634a1-a589-4d59-8791-221e03054017
- The Acuity Fourth Quarter 2025 and Full Year 2025 Infographic can be found here: https://investors.acuityinc.com/static-files/31f77eb0-18cd-44ba-8764-db605e38edba
- The Acuity Brands 2024 Annual Report (Form 10-K) can be found here: https://www.investors.acuitybrands.com/static-files/52c568f2-0005-4091-9b59-78ec462f5a67
- The Acuity Brands Fourth Quarter 2024 and Full Year 2024 Results Presentation can be found here: https://www.investors.acuitybrands.com/static-files/66470ed8-7e58-4dec-b791-414f7c60b556
- The Acuity Brands Fourth Quarter 2024 Infographic can be found here: https://www.investors.acuitybrands.com/static-files/4979d4fc-7da6-451c-a9e7-0d950634da30
- The Acuity Brands 2023 Annual Report (Form 10-K) can be found here: https://www.investors.acuitybrands.com/node/21536/html
- The Acuity Brands Fourth Quarter 2023 and Full Year 2023 Results Presentation can be found here: https://www.investors.acuitybrands.com/static-files/8eb72138-0728-4eb0-a535-3462ff767944
- The Acuity Brands 2022 Annual Report can be found here: https://www.investors.acuitybrands.com/static-files/ed349777-c8e9-4dd2-ba98-d83219cbd098 + https://www.acuitybrands.com/-/media/abl/acuitybrands/files/documents/annual-report-2022.pdf?forcebehavior=open
- The Acuity Brands Fourth Quarter 2022 and Full Year 2022 Results Presentation can be found here: https://www.investors.acuitybrands.com/static-files/fa37f3cf-cce7-408e-9533-9ee3edbe0029
- The Acuity Brands 2021 Annual Report can be found here: https://www.investors.acuitybrands.com/static-files/bd4c2edc-4807-4862-8228-66e6d8edd356
- The Acuity Brands Fourth Quarter and Full Year 2021 Results Presentation can be found here: https://www.investors.acuitybrands.com/static-files/f70a5859-07a0-4f50-90c9-810c4419970a