
Danfoss – Danfoss report: electrification won’t succeed without energy efficiency

New Danfoss report concludes that any electrification strategy that does not put energy efficiency at its core risks falling short.
As global leaders gather at COP31 in Antalya, Türkiye, Danfoss today released a new report showing that the COP31 presidency’s target to increase electricity’s share of global final energy demand to 35% by 2035 must put energy efficiency at its core to avoid falling short.
Electrification is about more than replacing fossil fuels with electricity. It is an opportunity to strengthen competitiveness, enhance energy security, and accelerate competitive decarbonization. Electricity already powers nearly 40% of the energy services we rely on, while accounting for just 23% of the energy we consume. But reaching the 35% electrification target will require adding 1,400 TWh of new demand every year and expanding grids 40% faster than in the last decade.
Danfoss argues that this scale of transformation is only achievable if countries prioritize efficient end use, minimize conversion losses, and invest in flexible energy management.

Electrification is accelerating and we need more renewable generation, more grid capacity, and more infrastructure. But expanding capacity is only one part of the answer. We also need to make more efficient use of the electricity we generate and the infrastructure already in place. Many of the solutions are already available. The next phase of electrification is not simply about more electricity. It is about using electricity intelligently.
Mika Kulju
President, Danfoss Power Electronics and Drives

Energy efficiency is the cheapest and fastest way to accelerate electrification
Energy efficiency is the single most powerful lever to accelerate electrification, making it easier, cheaper, and faster to deploy across every sector.
Energy efficiency is consistently the lowest cost “resource” available, often costing less than half as much per unit of saved electricity as new generation and grid infrastructure. The reduction in demand – driven by proven technologies in buildings, industry, transport, and even hard-to-electrify sectors such as off-highway vehicles – allows electrification to move faster and reach more sectors. Efficiency measures can be deployed in less than a year, while grid infrastructure projects often take 5-15 years.
Efficient electrification in practice
Efficient electrification is not simply about replacing fossil fuels with electricity. It means first reducing the amount of energy required and then applying electrification where it delivers the greatest value.
This approach is especially important in sectors where full electrification remains challenging, such as non-road mobile machinery (NRMM). For equipment like excavators, efficiency improvements such as smart hydraulic systems which can reduce excavator energy use by up to 30 percent, and partial electrification can add further savings by allowing each subsystem to run at its optimal point, and by capturing energy that would otherwise be lost.
The same principle applies in industry, where electrification is most effective when it is integrated with waste heat recovery. At an aluminum plant in Denmark, heat pumps capture excess heat from production and upgrade it for space heating and industrial preheating. By reusing existing heat rather than generating new heat from gas, the system delivers several times higher efficiency while eliminating on-site gas use.
Efficient electrification is equally important in transport. Two electric ferries in Denmark combine battery propulsion with highly efficient power conversion systems and coordinated charging infrastructure, enabling reliable operation, fast turnarounds, and lower pressure on local electricity grids.
Together, these examples show that successful electrification depends on maximizing the value of every unit of electricity through efficiency, energy recovery, and system integration. This enables faster emissions reductions, lowers costs, and makes electrification viable in sectors that might otherwise be difficult to decarbonize.
The fundamentals that drive electrification
Bridging the gap between today’s electrification rate and the level needed to meet climate targets requires three fundamentals to be addressed:
- Efficiency: Using less energy. Lowering total demand boosts the scalability and speed of electrification by reducing need for investments, infrastructure, and new renewable energy capacity.
- Conversion: Wasting less energy. Conversion losses are significant, with 7% of 2024’s global electricity output lost in transmission and distribution grids. Minimizing conversion losses determines how far and fast electrification can scale.
- Management: Smarter energy use. Ensuring that energy is available at the right amount, at the right time, and at the right operating point will be critical as power loads increase. For example, scaling flexibility across the EU and UK could cut the generation capacity needed by 313 GW before 2050, showing that managing demand can be as powerful as building new supply.
The technologies needed to electrify efficiently already exist, but simultaneous and rapid action on each of these fundamentals is essential for progress.
Key highlights:
- Electricity already powers nearly 40% of the energy services we rely on, while accounting for just 23% of the energy we consume.
- Reaching 35% electrification by 2035 requires adding around 1,400 TWh of demand to the grid every year and expanding grids 40% faster than over the last 10 years.
- Energy efficiency is consistently the lowest cost “resource” available, often costing less than half as much per unit of saved electricity than new generation and grid infrastructure.

Enabling electrification: How energy efficiency can secure an affordable and scalable electric energy system
SourceDanfoss
EMR Analysis
More information on Danfoss: See the full profile on EMR Executive Services
More information on Kim Fausing (President and Chief Executive Officer, Danfoss): See the full profile on EMR Executive Services
More information on Jesper V. Christensen (Executive Vice President & Chief Financial Officer, Danfoss): See the full profile on EMR Executive Services
More information on LEAP 2030 by Danfoss: See the full profile on EMR Executive Services
More information on Danfoss Power Electronics and Drives by Danfoss: See the full profile on EMR Executive Services
More information on Mika Kulju (Member of the Group Executive Team, President Danfoss Power Electronics and Drives, Danfoss + Chairman of the Board, Semikron Danfoss, Danfoss): See the full profile on EMR Executive Services
More information on COP31 – Climate Change Conference (9th till 20th of November 2026, Antalya, Türkiye): https://cop31.tr/ + COP (Conference of the Parties) is the highest-level global climate summit held annually under the United Nations Framework Convention on Climate Change (UNFCCC), which was adopted in 1992. Bringing together heads of state, ministers, scientists, business leaders, and civil society representatives from around the world, COP serves as the primary platform for negotiating and advancing collective action to combat climate change. COP31 marks the 31st session of this global process and will be hosted by Türkiye in 2026.
Türkiye is hosting COP31 including the World Leaders’ Summit in the city of Antalya from 9 to 20 November 2026. Australia is the President of Negotiations for COP31.
COP31 will focus on delivery and acceleration – turning commitments from the Paris Agreement into practical outcomes.
More information on Murat Kurum (President-Designated, COP31 Türkiye + Minister, Environment, Urbanization and Climate Change, Türkiye): https://cop31.tr/leader/murat-kurum# + https://iklim.gov.tr/en/minister-i-71 + https://www.linkedin.com/company/murat-kurum/
More information on The European Union: https://european-union.europa.eu/index_en + The European Union’s institutional set-up is unique and its decision-making system is constantly evolving. The 7 European institutions, 7 EU bodies and over 30 decentralized agencies are spread across the EU. They work together to address the common interests of the EU and European people.
In terms of administration, there are a further 20 EU agencies and organisations which carry out specific legal functions and 4 inter institutional services which support the institutions.
All of these establishments have specific roles – from developing EU laws and policy-making to implementing policies and working on specialist areas, such as health, medicine, transport and the environment.
There are 4 main decision-making institutions which lead the EU’s administration. These institutions collectively provide the EU with policy direction and play different roles in the law-making process:
- The European Parliament (Brussels/Strasbourg/Luxembourg)
- The European Council (Brussels)
- The Council of the European Union (Brussels/Luxembourg)
- The European Commission (Brussels/Luxembourg/Representations across the EU)
Their work is complemented by other institutions and bodies, which include:
- The Court of Justice of the European Union (Luxembourg)
- The European Central Bank (Frankfurt)
- The European Court of Auditors (Luxembourg)
The EU institutions and bodies cooperate extensively with the network of EU agencies and organisations across the European Union. The primary function of these bodies and agencies is to translate policies into realities on the ground.
Around 60,000 EU civil servants and other staff serve the 450 million Europeans (and countless others around the world).
Currently, 27 countries are part of the EU: https://european-union.europa.eu/principles-countries-history/country-profiles_en
More information on The European Commission by The European Union: https://ec.europa.eu/info/index_en + The Commission helps to shape the EU’s overall strategy, proposes new EU laws and policies, monitors their implementation and manages the EU budget. It also plays a significant role in supporting international development and delivering aid.
The Commission is steered by a group of 27 Commissioners, known as ‘the college’. Together they take decisions on the Commission’s political and strategic direction.
A new college of Commissioners is appointed every 5 years.
The Commission is organised into policy departments, known as Directorates-General (DGs), which are responsible for different policy areas. DGs develop, implement and manage EU policy, law, and funding programmes. In addition, service departments deal with particular administrative issues. Executive agencies manage programmes set up by the Commission.
Principal roles in law: The Commission proposes and implements laws which are in keeping with the objectives of the EU treaties. It encourages input from business and citizens in the law-making process and ensures laws are correctly implemented, evaluated and updated when needed.
More information on Ursula von der Leyen (President, The European Commission, The European Union): https://ec.europa.eu/commission/commissioners/2019-2024/president_en + https://www.linkedin.com/in/ursula-von-der-leyen/
EMR Additional Notes:
- Carbon Dioxide (CO2):
- The primary greenhouse gas emitted through human activities. Carbon dioxide enters the atmosphere through the burning of fossil fuels (coal, natural gas, and oil), solid waste, biomass (e.g. wood), and also as a result of certain industrial chemical reactions (e.g. cement production).
- Carbon dioxide is removed from the atmosphere (or “sequestered”) when it is absorbed by plants as part of the biological carbon cycle and through ocean absorption and geological processes. In climate accounting, however, “carbon sequestration” generally refers to the removal and storage of carbon in a reservoir; natural uptake through the carbon cycle is not necessarily classified as anthropogenic carbon dioxide removal (CDR).
- CO₂ is naturally part of the carbon cycle, but human activities have significantly increased its concentration in the atmosphere.
- Biogenic Carbon Dioxide (CO2):
- Biogenic CO₂ and fossil-derived CO₂ are chemically identical molecules.
- The distinction is not chemical, but source-based:
- Biogenic carbon: CO₂ released from organic materials such as plants, wood, soil, and biomass that were recently part of the natural carbon cycle. Its accounting treatment depends on the applicable carbon-accounting methodology and whether the carbon is considered part of the contemporary biogenic carbon cycle.
- Fossil carbon: CO₂ released from fossil fuels (coal, oil, gas), which were stored underground for millions of years. This introduces additional carbon into the active atmospheric carbon cycle and is therefore generally treated as fossil CO₂ emissions.
- CO2e (Carbon Dioxide Equivalent):
- CO₂e means “carbon dioxide equivalent”.
- It is a standardized climate metric used to express the total climate impact of multiple greenhouse gases in a single standardized unit.
- CO₂e converts all greenhouse gases (such as methane and nitrous oxide) into the amount of CO₂ that would have the same integrated radiative forcing / climate impact over a defined time period using a specified Global Warming Potential (GWP) value.
- Formula: CO₂e = mass of gas × Global Warming Potential (GWP)
- Carbon dioxide equivalents are commonly expressed as million metric tonnes of carbon dioxide equivalents, abbreviated as MtCO₂e or Mt CO₂-eq; “MMTCDE” is used in some datasets but is not the preferred general notation.
- The carbon dioxide equivalent for a gas is derived by multiplying the tonnes of the gas by the associated GWP: CO₂e = mass of gas × GWP.
- For example, the GWP for methane is approximately 27–30 under IPCC AR6 depending on the methane source and accounting convention, while the 100-year GWP for nitrous oxide is 273. This means that emissions of 1 million metric tonnes of methane and nitrous oxide respectively would correspond to approximately 27–30 and 273 million metric tonnes of CO₂e under those GWP assumptions.
- Carbon Footprint:
- There is no universally agreed definition of what a carbon footprint is.
- The most widely used definition (GHG Protocol) describes it as: “The total set of greenhouse gas (GHG) emissions caused directly and indirectly through an organization’s operations and value chain.” The GHG Protocol generally refers to corporate GHG inventories and Scope 1, 2 and 3 emissions rather than prescribing one universal definition of “carbon footprint.”
- A carbon footprint is the total amount of greenhouse gas (GHG) emissions caused directly and indirectly by an individual, organization, product, or activity.
- It is typically measured in CO₂e.
- Decarbonization:
- Reduction of carbon dioxide emissions through the use of low-carbon energy sources and improved efficiency, with the goal of reducing overall greenhouse gas emissions. More broadly, decarbonization refers to reducing the carbon intensity and/or absolute greenhouse-gas emissions of an economy, sector, organization, product, or process, potentially including CO₂ removal for residual emissions.
- Decarbonization typically refers to system-wide transition, not only emission reduction at a single source.
- Carbon Credits or Carbon Offsets:
- Carbon credits are tradable certificates representing the verified reduction or removal of one metric tonne of CO₂e, generally generated by a specific project or activity; terminology and quality criteria vary between carbon markets.
- They are part of cap-and-trade systems, where:
- A cap limits total emissions
- Companies receive or buy emission allowances
- Excess allowances can be traded
- Offsets are often linked to external projects that reduce or remove emissions (e.g. reforestation, renewable energy). A carbon offset is generally a credit representing a reduction or removal outside the entity’s own emissions boundary that may be used to compensate for emissions, subject to the applicable programme or claim rules.
- Carbon credits and emission allowances should not be treated as synonymous: an allowance is a regulated authorization to emit under a cap-and-trade system, whereas a credit/offset generally represents a quantified emission reduction or removal.
- Carbon Capture and Storage (CCS) – Carbon Capture, Utilisation and Storage (CCUS):
- CCS involves capturing CO₂ emissions from industrial processes or other concentrated sources and storing them permanently in geological formations (e.g. underground reservoirs).
- CCUS adds a utilization step, where captured CO₂ is reused as a feedstock (e.g. fuels, chemicals, building materials). More precisely, CCUS refers to carbon capture followed by utilization and/or storage; utilization does not necessarily result in permanent carbon storage.
- CCS = capture + geological storage; CCUS = capture + utilization and/or storage.
- Carbon Dioxide Removal (CDR) or Durable Carbon Removal:
- CDR refers to methods that actively remove CO₂ from the atmosphere and store it for long periods in geological, biological, or mineral form. CDR specifically requires an anthropogenic activity that removes atmospheric CO₂ and durably stores it in geological, terrestrial, ocean, or product reservoirs.
- Examples include:
- Direct Air Capture (DAC)
- Bioenergy with Carbon Capture (BECCS)
- Enhanced Rock Weathering (ERW)
- CDR creates net negative emissions when removal exceeds emissions. A CDR activity itself can provide a net removal only when the total emissions associated with the removal process are lower than the amount of CO₂ durably removed and stored.
- Direct Air Capture (DAC):
- Technologies that extract CO2 directly from the atmosphere at any location, unlike carbon capture which is generally carried out at the point of emissions, such as a steel plant. DAC can capture CO₂ from ambient air regardless of where the original emissions occurred; it is distinct from point-source carbon capture.
- Constraints like costs and energy requirements as well as the potential for pollution make DAC a less desirable option for CO2 reduction. Its larger land footprint when compared to other mitigation strategies like carbon capture and storage systems (CCS) also put it at a disadvantage. However, DAC is a potential carbon-removal technology rather than simply a CO₂-reduction technology, and its climate benefit depends strongly on the energy source, capture efficiency, permanence of storage, and lifecycle emissions.
- Direct Air Capture and Storage (DACCS):
- Climate technology that removes carbon dioxide (CO2) directly from the ambient atmosphere using large fans and chemical processes to bind with the CO2. The captured CO₂ is then transported and durably stored, typically in geological formations.
- DACCS is therefore a specific form of CDR: DAC + durable CO₂ storage.
- Bioenergy with Carbon Capture and Storage (BECCS):
- Technology that generates energy from biomass while capturing and storing the resulting CO₂.
- Because biomass absorbs CO₂ while growing, BECCS can result in net negative emissions. It can result in net negative emissions when the full lifecycle emissions—including biomass production, harvesting, transport, processing, energy use, and capture/storage—are sufficiently lower than the amount of biogenic CO₂ durably removed from the atmosphere.
- Enhanced Rock Weathering (ERW):
- Carbon dioxide removal (CDR) technique that accelerates the natural process of rock weathering by grinding silicate rocks into dust and spreading it on land, typically agricultural fields. This process enhances reactions with water and atmospheric CO₂, converting dissolved carbon into bicarbonate and, ultimately, carbonate minerals or transporting dissolved inorganic carbon to aquatic systems, where it can be stored over long timescales.
- Its effectiveness and permanence depend on rock type, particle size, weathering rates, transport pathways, soil and water chemistry, and the emissions associated with mining, grinding, and transporting the rock.
- Limits of Carbon Dioxide Storage:
- Carbon storage is not endless; the Earth’s capacity for permanently storing vast amounts of captured carbon, particularly in geological formations, is limited, potentially reaching a critical limit of 1,460 gigatonnes at around 2200, though storage durations vary significantly depending on the method, from decades for some biological methods to potentially millions of years for others like mineralization. Estimates of geological storage capacity vary widely and depend on geology, reservoir characteristics, storage efficiency, infrastructure, economics, regulation, monitoring, and permanence.
- While some methods offer very long-term storage, the sheer volume needed to meet climate targets requires scaling up storage significantly beyond current capacity, raising concerns about the available volume over time. The practical constraint is therefore better described as the need to develop sufficient safe, permanent, economically and technically accessible storage capacity rather than a single known global physical limit.
- Carbon Impregnation:
- Carbon impregnation is the process of treating activated carbon with chemical agents (such as metals, acids, or bases) to enhance its ability to adsorb specific, hard-to-remove pollutants. By loading substances like silver, sulfur, or potassium hydroxide into its pores, this material combines physical adsorption with chemical reaction for improved, targeted filtration in water and air. This is a materials engineering process, not a climate accounting concept.
- Global Warming:
- Global warming is the long-term heating of Earth’s climate system observed since the pre-industrial period (between 1850 and 1900) due to human activities, primarily fossil fuel burning, which increases heat-trapping greenhouse gas levels in Earth’s atmosphere. Global warming refers specifically to the long-term increase in Earth’s average surface temperature; climate change is the broader term encompassing associated changes in climate systems, including precipitation, extremes, sea level, and ecosystems.
- Global Warming Potential (GWP):
- A measure of how much heat a greenhouse gas contributes to climate warming relative to CO₂ over a specific time period (commonly 100 years).
- CO₂ has a GWP of 1.
- GWP is the scientific basis for converting gases into CO₂e.
- GWP was developed to allow comparisons of the global warming impacts of different gases. The numerical GWP depends on the selected IPCC assessment, time horizon, and, for some gases such as methane, the emission source and accounting convention.
- Greenhouse Gas (GHG):
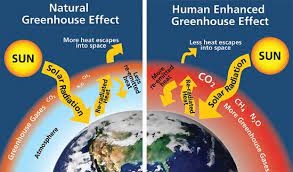
- Any gas that absorbs and emits infrared radiation in the atmosphere, contributing to the greenhouse effect.
- Main GHGs include:
- CO₂
- Methane (CH₄)
- Nitrous oxide (N₂O)
- Fluorinated gases such as HFCs, PFCs, SF₆ and NF₃
- Water vapor is a GHG but is not directly controlled by human emissions at scale. It is primarily a feedback in the climate system rather than a direct target of conventional anthropogenic GHG inventories.
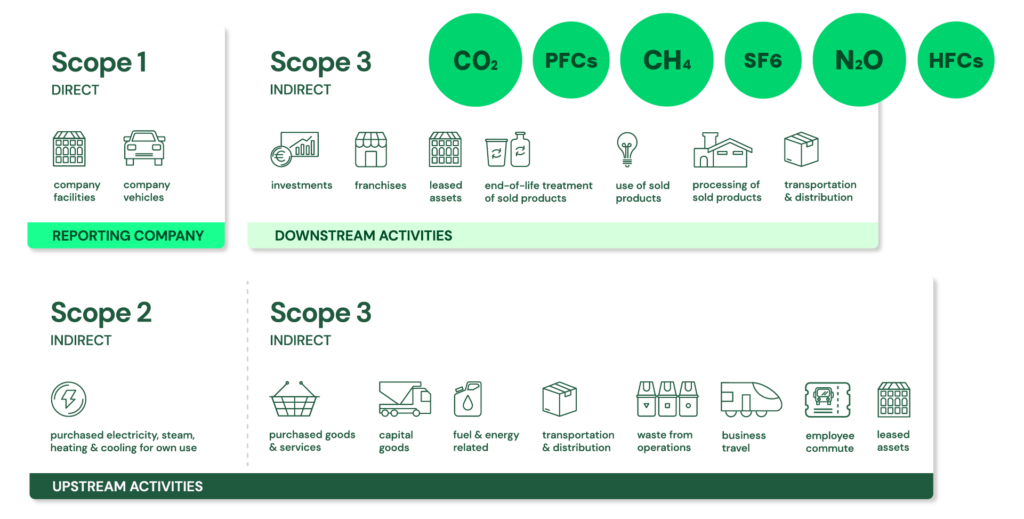
- GHG Protocol Corporate Standard Scope 1, 2 and 3: https://ghgprotocol.org/ + The GHG Protocol Corporate Accounting and Reporting Standard provides requirements and guidance for companies and other organizations preparing a corporate-level GHG emissions inventory. The Corporate Standard itself is voluntary, although companies may be required by applicable legislation or regulation to report using the GHG Protocol or equivalent requirements.
- Scope 1: Direct emissions:
- Direct emissions from company-owned and controlled resources. In other words, emissions are released into the atmosphere as a direct result of a set of activities, at a firm level. More precisely, Scope 1 covers direct GHG emissions from sources that are owned or controlled by the reporting organization.
- It is divided into four categories:
- Stationary combustion (e.g from fuels, heating sources). All fuels that produce GHG emissions must be included in scope 1. This applies when the combustion source is owned or controlled by the reporting organization.
- Mobile combustion is all vehicles owned or controlled by a firm, burning fuel (e.g. cars, vans, trucks). The increasing use of “electric” vehicles (EVs), means that some of the organisation’s fleets could fall into Scope 2 emissions. For example, fuel combustion in an owned/controlled vehicle is Scope 1, whereas electricity purchased to charge an EV is generally Scope 2; an EV itself does not create Scope 2 emissions—the purchased electricity does.
- Fugitive emissions are leaks from greenhouse gases (e.g. refrigeration, air conditioning units). It is important to note that refrigerant gases are not uniformly “a thousand times more dangerous” than CO₂; some refrigerants have GWPs of hundreds or thousands of times that of CO₂, while others have much lower values. Companies are encouraged to report these emissions.
- Process emissions are released during industrial processes, and on-site manufacturing (e.g. production of CO2 during cement manufacturing, factory fumes, chemicals). These are direct emissions resulting from physical or chemical processes other than fuel combustion, such as calcination in cement production..
- Scope 2: Indirect emissions – owned:
- Indirect emissions from the generation of purchased energy, from a utility provider. In other words, all GHG emissions released in the atmosphere, from the consumption of purchased electricity, steam, heat and cooling. Scope 2 covers indirect GHG emissions associated with the generation of purchased or acquired electricity, steam, heat, and cooling consumed by the reporting organization; “owned” is therefore misleading because the emissions source is owned or controlled by another entity.
- For most organisations, electricity will be the unique source of scope 2 emissions. Simply stated, the energy consumed falls into two scopes: Scope 2 covers the electricity consumed by the end-user. Scope 3 covers the energy used by the utilities during transmission and distribution (T&D) losses. More precisely, Scope 2 covers the generation-related emissions associated with purchased electricity, not the physical electricity itself. T&D losses are generally accounted for in Scope 3 Category 3 for an energy consumer that does not own the T&D system, although the treatment can vary depending on ownership and accounting circumstances.
- Scope 3: Indirect emissions – not owned:
- Indirect emissions – not included in scope 2 – that occur in the value chain of the reporting company, including both upstream and downstream emissions. In other words, emissions are linked to the company’s operations. According to the GHG protocol, scope 3 emissions are separated into 15 categories. Scope 3 therefore captures other indirect value-chain emissions, upstream and downstream, across the 15 defined categories of the Scope 3 Standard.
- Scope 1: Direct emissions:
- Fundamental Electrical Quantities and Units:
- Electric Current:
- Ampere (A): The ampere is the SI unit of electric current. Electric current represents the rate of flow of electric charge through a system. Depending on the medium, charge may be carried by electrons, ions, holes or other charge carriers.
- 1 A = 1 C/s
- In the current SI, the ampere is defined by fixing the elementary charge at exactly 1.602 176 634 × 10⁻¹⁹ C.
- Milliampere (mA): The milliampere is a unit of electric current equal to one-thousandth of an ampere.
- 1 mA = 10⁻³ A
- It is commonly used for small currents in electronic circuits, sensors, control systems and low-power devices.
- Kiloampere (kA): The kiloampere is a unit of electric current equal to 1,000 amperes.
- 1 kA = 10³ A
- It is commonly used to express high electrical currents, such as short-circuit currents, busbar ratings and current ratings of large electrical equipment.
- Ampere (A): The ampere is the SI unit of electric current. Electric current represents the rate of flow of electric charge through a system. Depending on the medium, charge may be carried by electrons, ions, holes or other charge carriers.
- Electrical Potential Difference (Voltage):
- Volt (V): The volt is the SI unit of electric potential difference, commonly called voltage. Voltage represents the difference in electric potential energy per unit electric charge between two points:
- 1 V = 1 J/C
- A potential difference can produce an electric current when an appropriate conductive path and circuit conditions exist.
- Kilovolt (kV): The kilovolt is a unit of electric potential difference equal to 1,000 volts:
- 1 kV = 10³ V
- Volt (V): The volt is the SI unit of electric potential difference, commonly called voltage. Voltage represents the difference in electric potential energy per unit electric charge between two points:
- Electrical Power and Energy:
- Power: Power is the rate at which energy is transferred, converted or delivered. The SI unit of power is the watt (W):
- 1 W = 1 J/s
- Electrical power may be expressed in W, kW, MW, GW or TW.
- Energy: Energy is the amount of energy transferred, converted or stored. Electrical energy is commonly expressed in joules (J) or watt-hours (Wh), including kWh, MWh and GWh.
- For constant power:
- Energy = Power × Time
- For variable power, energy is obtained by integrating power over time.
- Electrical energy consumption is commonly billed in kWh, although electricity tariffs may also include charges based on demand or capacity.
- Power: Power is the rate at which energy is transferred, converted or delivered. The SI unit of power is the watt (W):
- Real or Active Power:
- Real power (P), also called active power, is the average rate of net energy transfer in an electrical system. It represents the portion of electrical power associated with net transfer or conversion of energy, such as mechanical work, heat or light. It is expressed in watts (W) and its multiples.
- Kilowatt (kW): 1 kW = 1,000 W.
- Megawatt (MW): 1 MW = 1,000 kW = 1,000,000 W.
- Gigawatt (GW): 1 GW = 1,000 MW = 1,000,000,000 W.
- Terawatt (TW): 1 TW = 1,000 GW = 10¹² W. It is used for very large power levels, such as aggregated national or global generating capacity or instantaneous electrical demand. Energy consumed or generated over time should instead be expressed in units such as TWh.
- Apparent and Reactive Power:
- Apparent power (S) is a measure of the total RMS voltage-current loading of an AC system and is expressed in volt-amperes (VA). For sinusoidal AC:
- S = V × I
- Apparent power encompasses both active and reactive power. The apparent-power rating of equipment such as transformers, generators and UPS systems is commonly specified in VA, kVA or MVA.
- Kilovolt-ampere (kVA): 1 kVA = 1,000 VA.
- Megavolt-ampere (MVA): 1 MVA = 1,000 kVA = 1,000,000 VA.
- Reactive power (Q) is the component of AC power associated with the periodic exchange of energy between the electrical system and reactive elements such as inductors and capacitors. It is expressed in var (volt-amperes reactive), kVAr or MVAr.
- For sinusoidal AC: S² = P² + Q²
- and:
- P = S × power factor
- Thus, at a power factor below unity, apparent power is greater than active power.
- Apparent power (S) is a measure of the total RMS voltage-current loading of an AC system and is expressed in volt-amperes (VA). For sinusoidal AC:
- Specialized Renewable Energy Unit:
- Kilowatt-peak (kWp):
- kWp is a conventional designation for the rated peak power of a photovoltaic module or system under specified reference test conditions. It is a power rating, not a unit of energy. For conventional crystalline-silicon PV modules, Standard Test Conditions (STC) use an irradiance of 1,000 W/m², a cell temperature of 25°C and a specified reference solar spectrum.
- For example, four 270 W modules have a combined nominal peak rating of: 4 × 270 W = 1.08 kWp
- Actual electricity production depends on solar irradiance, orientation, tilt, shading, temperature, system losses, degradation and other operating conditions. Therefore, a kWp rating does not imply a fixed annual energy yield in kWh.
- Kilowatt-peak (kWp):
- Electric Current:
- Grid, Microgrids, DERs and DERM’s:
- Grid / Power Grid:
- The power grid is a network for delivering electricity to consumers. The power grid includes power generation facilities, substations, transmission lines and towers, distribution networks, protection and control equipment, and associated communication and monitoring infrastructure.
- The grid continuously balances electricity generation and consumption while maintaining system stability and power quality, supplying electricity for applications ranging from industry to household appliances.
- Electric grids perform three major functions or stages of electricity supply: power generation, transmission, and distribution. Grid operation also includes functions such as system balancing, protection, control, monitoring, and, increasingly, energy storage and demand-side management.
- The power grid is a network for delivering electricity to consumers. The power grid includes power generation facilities, substations, transmission lines and towers, distribution networks, protection and control equipment, and associated communication and monitoring infrastructure.
- Microgrid:
- A microgrid is a group of interconnected loads and distributed energy resources (DERs) within clearly defined electrical boundaries that acts as a single controllable entity with respect to the main grid and can operate either connected to the main grid or, when appropriately designed, intentionally and controllably in an islanded mode.
- Microgrids can integrate local generation, energy storage, controllable loads, and other DERs to improve resilience, flexibility, efficiency, or local energy management.
- A microgrid is a group of interconnected loads and distributed energy resources (DERs) within clearly defined electrical boundaries that acts as a single controllable entity with respect to the main grid and can operate either connected to the main grid or, when appropriately designed, intentionally and controllably in an islanded mode.
- Smart Grid:
- A smart grid is an electrical grid enhanced with digital communications, sensing, automation, control, and data/analytics technologies across generation, transmission, distribution, and/or customer-side systems to improve the monitoring, operation, efficiency, reliability, resilience, and flexibility of the power system.
- Distributed Energy Resources (DERs):
- Distributed energy resources (DERs) are relatively small-scale electricity generation, storage, and flexible demand resources, located at or near the distribution system or customer premises, that can supply, store, or modify electricity consumption and are interconnected to the electric grid. They are often located close to load centers and can be used individually or in aggregate to provide value to the grid.
- Common examples of DERs include rooftop solar PV units, small wind turbines, small gas-fired generators or engines/turbines, microturbines, biomass generators, fuel cells, combined heat and power (CHP) or tri-generation systems with electrical generation, battery storage, electric vehicles and controllable EV charging or discharging where they can provide grid flexibility, and demand response applications.
- Distributed energy resources (DERs) are relatively small-scale electricity generation, storage, and flexible demand resources, located at or near the distribution system or customer premises, that can supply, store, or modify electricity consumption and are interconnected to the electric grid. They are often located close to load centers and can be used individually or in aggregate to provide value to the grid.
- Distributed Energy Resources Management Systems (DERMS):
- Distributed Energy Resources Management Systems (DERMS) are software platforms that help utilities, distribution system operators (DSOs), aggregators, and other energy-sector organizations monitor, provide visibility into, forecast, coordinate, optimize, and, where supported, control distributed energy resources (DERs).
- DERMS can be used to aggregate and coordinate large numbers of DERs and flexible loads for grid services, including voltage and power-flow management, congestion and constraint management, balancing, flexibility services, resilience, and participation in demand-response or other electricity markets. DERMS can be defined in many ways, depending on the use case, the types of DERs being managed, the responsibilities of the organization using the system, and the architecture of the power system.
- Distributed Energy Resources Management Systems (DERMS) are software platforms that help utilities, distribution system operators (DSOs), aggregators, and other energy-sector organizations monitor, provide visibility into, forecast, coordinate, optimize, and, where supported, control distributed energy resources (DERs).
- Grid / Power Grid:
- Heat Exchangers, Heat Pumps, Air Source Heat Pump (ASHP), Hydronics, Geothermal Heating – Cooling & Chillers:
- Heat Exchangers – Heat Transfer Foundation:
- Used to transfer heat from one medium to another. These media may be a gas, liquid, or a combination of both. The media may be separated by a solid wall to prevent mixing or may be in direct contact. Heat exchangers are required to provide heating and/or cooling to meet a process requirement.
- In HVAC, heat exchangers are used to transfer heat between the indoor and outdoor air streams while keeping them physically separated as a means of cooling or heating indoor air. heat exchangers are components; systems performing heating/cooling cycles are heat pumps, not the heat exchangers themselves.
- Gasketed heat exchangers are compact, highly efficient devices used to transfer heat between two fluids without mixing them. They consist of a series of corrugated metal plates fitted with elastomeric gaskets that seal the channels and direct the fluids into alternate pathways. This design creates high turbulence, maximizing heat transfer efficiency while maintaining a significantly smaller footprint than traditional shell-and-tube units.
- Heat Pumps – Thermodynamic Systems (Energy Transfer Devices):
- Use electricity to transfer heat from a cool space to a warm space, making the cool space cooler and the warm space warmer. During the heating season, heat pumps move heat from the cool outdoors into your warm house. During the cooling season, heat pumps move heat from your house into the outdoors. Because they transfer heat rather than generate heat, heat pumps can efficiently provide comfortable temperatures for your home. They operate on a vapor-compression refrigeration cycle (similar to air conditioners and chillers).
- Air Source Heat Pump (ASHP) – Thermodynamic Systems (Energy Transfer Devices):
- Heating and cooling system that extracts heat from the outside air and transfers it to a building’s interior for heating, or reverses the process to cool the building. ASHPs are a low-carbon alternative to traditional heating systems like gas boilers or oil furnaces. They are efficient because they transfer heat rather than generating it, typically providing a coefficient of performance (COP) of ~2–4 under typical conditions (can vary significantly with temperature).
- The only difference between a heat pump and a chiller is that one is designed to remove heat from a space or process stream, making it cooler and rejecting heat to the environment, while the other is designed to extract heat from the environment and use it to provide useful heat.
- Chillers – Cooling Systems (Heat Removal Focus):
- Mechanical systems that remove heat from a building’s liquid coolant, typically water, and transfer it to another location to cool the air and maintain comfort. Unlike traditional systems that might cool air directly, chillers generate chilled water that circulates through air handling units (AHUs) within the space to absorb heat, making them essential for cooling large commercial or industrial buildings.
- Chillers and heat pumps use similar thermodynamic cycles, but are designed and optimized for different applications (process/central cooling vs reversible heating/cooling).
- The only difference between a heat pump and a chiller is not strictly the function, but primarily the design intent and system integration:
- A chiller is typically designed to remove heat from a space or process (cooling-focused).
- A heat pump is designed to provide useful heating (and often reversible cooling).
- Hydronics – Distribution Systems (Energy Transport):
- Systems of heating or cooling that involves transfer of heat by a circulating fluid (such as water or vapor) in a closed system of pipes. Hydronic systems distribute thermal energy (heating or cooling) but do not generate it themselves.
- Geothermal Heating and Cooling Systems – Renewable / Ground-Based Systems:
- Take advantage of the relatively stable temperature underground using a piping system, commonly referred to as a “loop.” Water or a water-antifreeze mixture circulates in the loop to exchange heat between your home, the ground source heat pump, and the earth, providing geothermal heating, cooling, and hot water at very high efficiencies (often higher than ASHPs).
- Heat Exchangers – Heat Transfer Foundation: