Signify – Signify’s third quarter results 2026


Signify reports third quarter results highlighting progress on strategy execution with sequential strengthening of profitability
Highlights1
- Sales of EUR 1,367 million with comparable sales growth of -3.4% (Q3 25: -3.9%)
- Adjusted EBITA of EUR 145 million (Q3 25: EUR 136 million), with a margin of 10.6% (Q3 25: 9.7%), including a EUR 28 million or 2.1 % net benefit from the US tariff refund
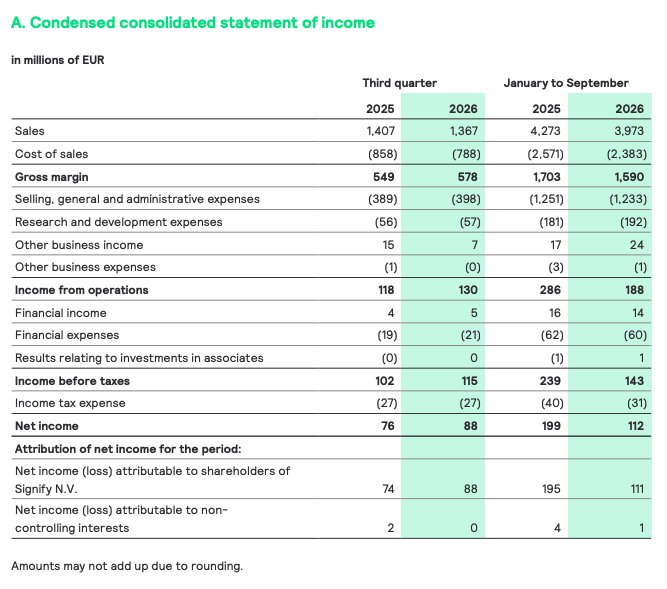
- Net income of EUR 88 million (Q3 25: EUR 76 million)
- Free cash flow of EUR 118 million (Q3 25: EUR 71 million)
- Received a Platinum EcoVadis sustainability rating for the seventh consecutive year, with a record score of 88/100 and a top 1% ranking globally.
Eindhoven, the Netherlands – Signify (Euronext: LIGHT), the world leader in lighting, today announced the company’s third quarter results of 2026.
“Our third-quarter results show that we are making progress in executing our strategy to build a more focused, better performing Signify. Despite continuing market weakness, we sequentially strengthened our profitability, reflecting disciplined pricing and strong cost management.
In our Harvest portfolio, our turnaround plans are on track, with OEM and Genlyte delivering improved profitability. We are following through on our portfolio choices in the Build portfolio: accelerating growth in and beyond lighting in India, taking decisive action in our Professional Europe business, and investing in customer acquisition in Consumer, while taking steps to improve productivity. In parallel, we are focusing our R&D investments on the areas where innovation can deliver the greatest returns.
Our teams continue to execute with great agility, mitigating higher input costs and supply constraints, while advancing the changes we have set out in our strategy. Our EcoVadis Platinum rating for the seventh consecutive year, with our highest-ever score, is further recognition of the strength of our approach. We remain focused on the actions within our control: making clear portfolio choices, improving performance and maintaining resilient margins as we build a stronger Signify.” said As Tempelman, CEO of Signify.
Outlook
Signify confirms its full-year adjusted EBITA margin guidance at the higher end of the 7.5–8.5% range including US tariff refunds received through the third quarter, and at the lower end excluding these refunds. Free cash flow guidance remains unchanged at 6.5–7.5% of sales.
Signify expects challenging market conditions to persist, with continued pressure in Professional Europe and softening of US project demand. Combined with a strong prior-year comparable in Consumer, fourth-quarter comparable sales growth is expected to be in line with or slightly below the third quarter.
US tariff refund
Signify completed a large part of the IEEPA tariff refund process and recognized the tariff refund received during the third quarter. These refunds are related to import duties previously paid on products imported into the United States. After associated supplier settlements, customer credits and related employee incentive accruals, the US tariff refund resulted in a net benefit of EUR 28 million to Adjusted EBITA.
Financial review
Third quarter
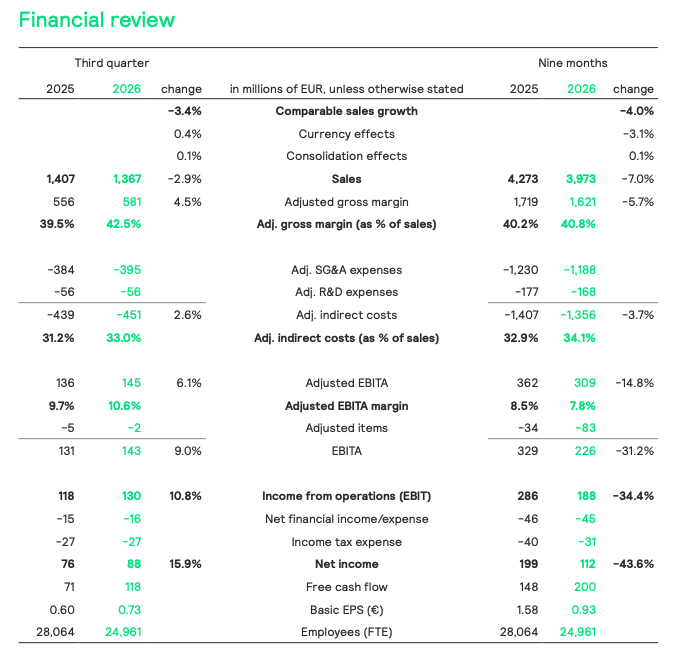
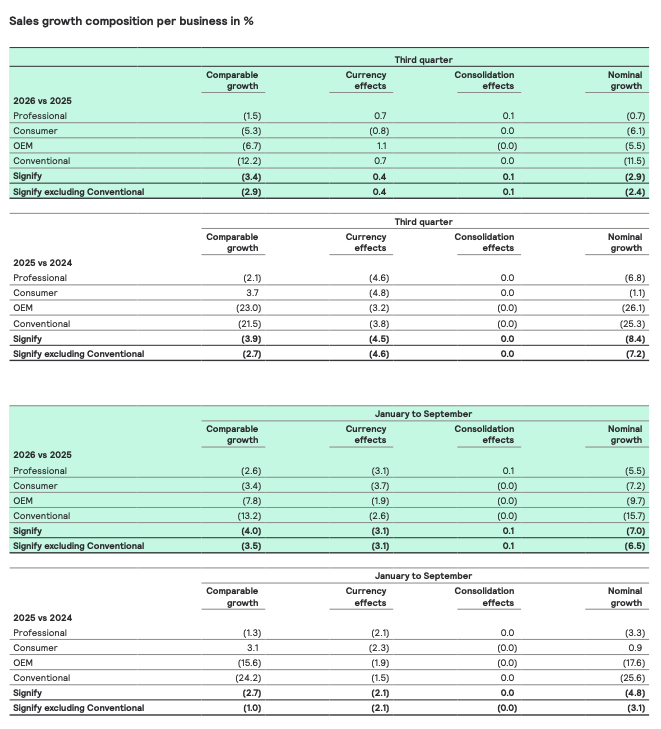
Nominal sales decreased by 2.9% to EUR 1,367 million, including a positive currency effect of 0.4%. Comparable sales declined by 3.4%.
The adjusted gross margin increased by 300 bps to 42.5%, including the contribution from US tariff refund. Excluding this benefit, the underlying gross margin improved slightly compared with the previous year, supported by positive pricing across all businesses and disciplined COGS management, which more than offset increased input cost pressure.
Signify’s cost reduction program is on track and measures have delivered gross savings of EUR 37 million in the third quarter. These savings were offset by an unfavorable year-on-year employee incentive accrual comparison, salary inflation and higher variable costs including commissions and advertising and promotion spend. As a result, adjusted indirect costs
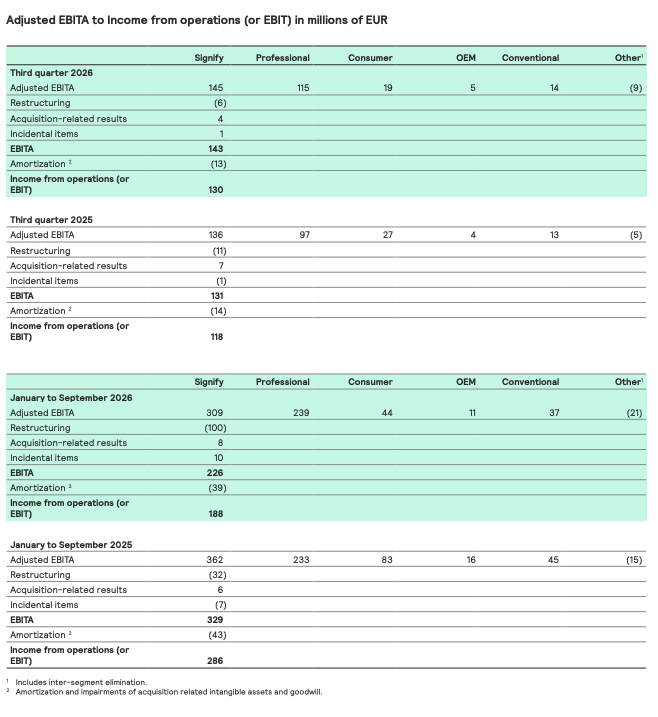
Adjusted EBITA increased to EUR 145 million, including a net benefit of EUR 28 million from US tariff refund. The Adjusted EBITA margin increased by 90 bps to 10.6%, including a 210 bps contribution from tariff refund. Excluding this benefit, the underlying Adjusted EBITA margin was 8.5%, reflecting softer sales and margin pressure in the Consumer business, while ongoing cost reductions and a strong gross margin helped stabilize profitability.
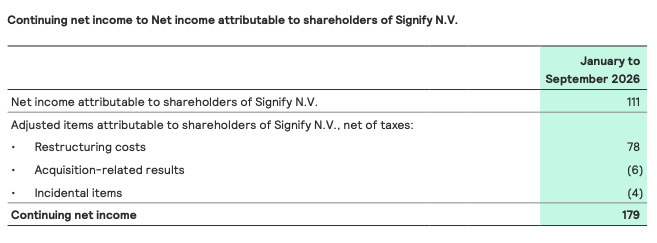
Net income increased to EUR 88 million, also reflecting the benefit from the US tariff refund and adjusted items of EUR -2 million. Signify’s continuing net income for the nine-month period ending 30 September 2026 was EUR 179 million.
The number of employees (FTE) decreased from 28,064 at the end of Q3 25 to 24,961 at the end of Q3 26. The year-on-year decrease is related to lower factory headcount due to reduced production volumes, as well as workforce reductions resulting from the cost reduction program announced in January 2026. In general, the number of FTEs is affected by fluctuations in volume and seasonality.
Professional
Third quarter
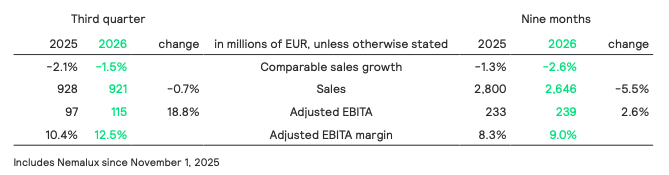
Nominal sales decreased by 0.7% to EUR 921 million, while comparable sales declined by 1.5%. The project business remained resilient in the US and Rest of the World, while softness continued in the stock-and-flow business across most geographies. Agriculture lighting delivered a strong performance during its high season.
The Adjusted EBITA margin increased to 12.5%, including a 2.0% net benefit from US tariff refund. Excluding this benefit, the underlying Adjusted EBITA margin was stable year-on -year, as gross margin expansion and fixed cost reductions were offset by lower sales volumes.
Consumer
Third quarter
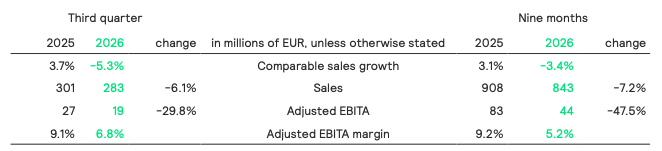
Nominal sales decreased by 6.1% to EUR 283 million, while comparable sales declined by 5.3%, mainly reflecting weaker Connected sales. Within Hue, sell-in remained affected by retailer destocking, resulting in a continued disconnect between retailer orders and underlying consumer demand. This was partly offset by growth of luminaires and in India.
The Adjusted EBITA margin decreased to 6.8% including a 2.3% net benefit from US tariff refund. Underlying profitability was impacted by lower sales volumes and under-absorption of fixed costs, particularly in Connected Consumer, with actions underway to address productivity and fixed costs.
OEM
Third quarter
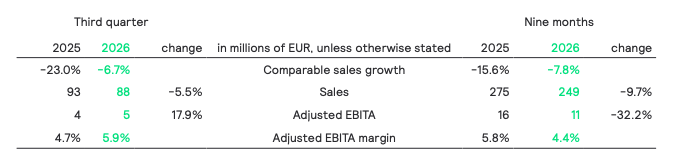
Nominal sales decreased by 5.5% to EUR 88 million, while comparable sales declined by 6.7%, reflecting continued market softness. Pricing trends improved across regions, resulting in positive pricing during the quarter.
The Adjusted EBITA margin increased by 120 bps to 5.9%, driven by gross margin expansion and continued savings from the cost reduction program. These benefits more than compensated for the impact of lower sales volumes, demonstrating the growing resilience of the business model despite a challenging demand environment.
Conventional
Third quarter
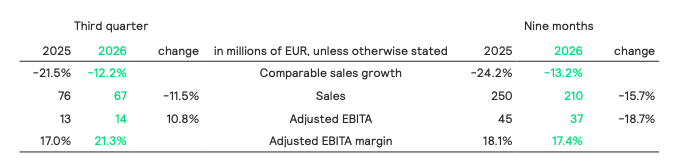
Nominal sales decreased by 11.5% to EUR 67 million, while comparable sales declined by 12.2%. Growth in Specialty Lighting continued during the quarter, partly offsetting lower sales in General Lighting, consistent with the structural decline of the business.
The Adjusted EBITA margin increased to 21.3%, including a 5.5% net benefit from US tariff refund.
Other
Third Quarter
‘Other’ reflects the P&L of Signify’s venture businesses, in addition to centrally incurred costs not assigned to individual businesses, predominantly those related to exploratory research initiatives and audit activities.
Nominal sales decreased to EUR 8 million (Q3 2025: EUR 9 million). Adjusted EBITA was at EUR -9 million (Q3 2025: EUR -5 million).
Working capital
Third quarter
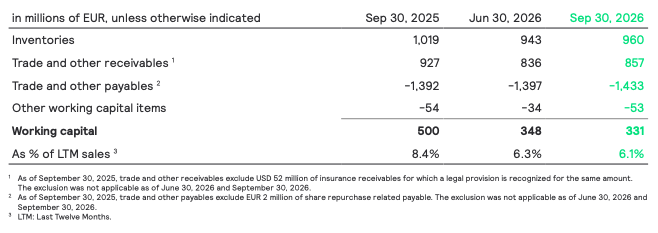
Working capital decreased from EUR 348 million at the end of June 2026 to EUR 331 million at the end of September 2026. The decrease is driven by higher payables, partly offset by higher receivables and inventories. As a percentage of last twelve-months sales, working capital decreased by 20 bps to 6.1%.
Compared with end of September 2025, working capital decreased by EUR 169 million. This decrease is explained by lower receivables and lower inventories. As a percentage of last twelve-months sales, working capital decreased by 230 bps.
Cash flow analysis
Third quarter
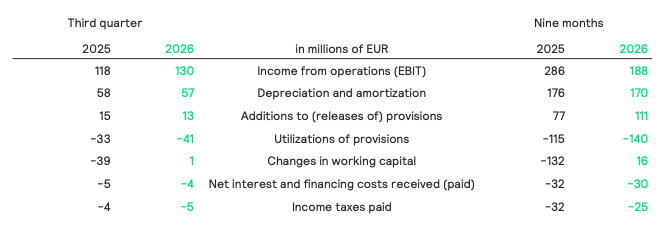
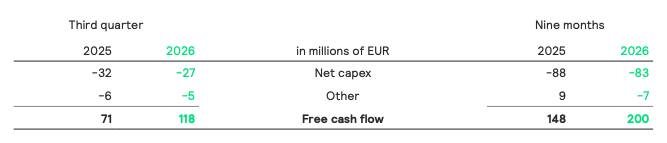
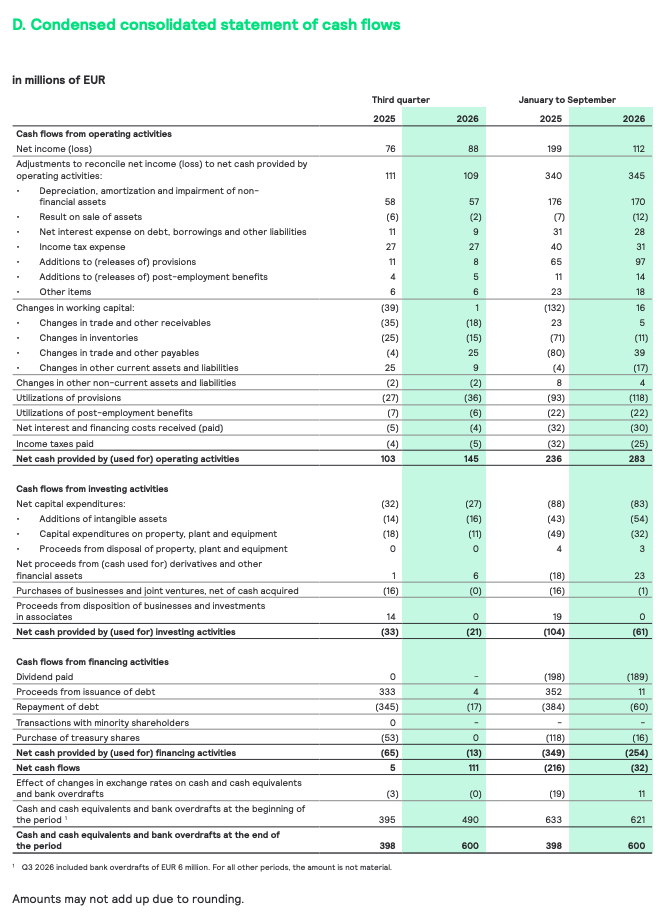
Free cash flow increased to EUR 118 million, primarily due to improved working capital management and US tariff refund. Free cash flow included a restructuring payout of EUR 22 million (Q3 25: EUR 11 million).
Net debt and total equity
Third quarter
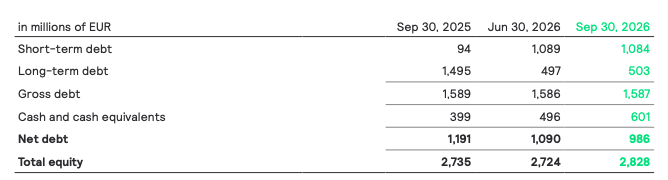
Compared with the end of June 2026, the cash position increased by EUR 105 million to EUR 601 million, mainly reflecting the positive free cashflow generation, while gross debt remained broadly stable at EUR 1,587 million. As a result, net debt decreased by EUR 104 million to EUR 986 million. Total equity increased from EUR 2,724 million at the end of June 2026, to EUR 2,828 million.
Compared with the end of September 2025, the cash position increased by EUR 202 million, primarily due to the free cash flow generation partially offset by the dividend payment and share buy back. Gross debt remained largely unchanged over the same period. As a result, the net debt decreased by EUR 205 million year on year. At the end of September 2026, the net debt/EBITDA ratio was 1.9x (Q3 25: 1.7x).
Brighter Lives, Better World 2030
In the third quarter of 2026, Signify made progress in advancing its Brighter Lives, Better World 2030 program, to expand the reach of energy- and resource-efficient lighting solutions that improve lives, save energy and preserve resources. Performance against program commitments progressed with all targets on track.
Benefits beyond illumination
Signify aims to expand the role of lighting that improves quality of life: supporting well-being, safety and security in homes, buildings and cities, enabling more efficient food production, and increasing access to solar lighting.
- Achieved Beyond illumination revenues of 36.3%, up from the 31% baseline and on target to reach 41% by the end of 2030. This performance was driven by strong growth in Professional emergency lighting solutions to support safety and security, alongside continued momentum in connected lighting systems.
Energy efficiency
Through continuous advances in LED and connected lighting, Signify aims to help customers reduce energy use, costs, and resulting emissions.
- Delivered 12 TWh of cumulative energy savings for our customers, on target to reach 60TWh of energy saving for customers by the end of 2030. Primary contribution from Professional connected, LED lamps and luminaires.
- 11.1% reduction in portfolio CO2e emission intensity annualized and on track to reach a 35% reduction by the end of 2030. This performance was primarily supported by the continued transition to LED technologies across the portfolio.
Resource efficiency and circular value
Signify scales circular products and services that aim to reduce the consumption of virgin materials and energy while delivering long-term customer value.
- Achieved 21.8% Signify Circle revenues in Professional Europe, up from the 10% baseline and on target to reach 27.5% by the end of 2030. Performance was primarily supported by Signify Circle designed outdoor lighting solutions, including road, sport and recreational lighting.
In the third quarter, Signify was awarded an EcoVadis Platinum Medal, reaffirming its position among the top 1% of companies assessed worldwide and underscoring its leadership in sustainability, climate action and responsible business practices.
Other information
- Appendix A – Selection of financial statements
- Appendix B – Reconciliation of non-IFRS financial measures
- Appendix C – Financial glossary
Conference call and audio webcast
As Tempelman (CEO) and Željko Kosanović (CFO) will host a conference call for analysts and institutional investors at 9:00 a.m. CET to discuss the third quarter 2026 results. A live audio webcast of the conference call will be available via the Investor Relations website.
Financial calendar 2026
- February 5, 2027: Fourth quarter and full-year results 2026
- February 23, 2027: Annual Report 2026
1This press release contains certain non-IFRS financial measures and ratios, which are not recognized measures of financial performance or liquidity under IFRS. For further details, refer to “Non-IFRS Financial Measures” in “Important information” of this press release.
Important information
Forward-Looking Statements and Risks & Uncertainties
This document and the related oral presentation contain, and responses to questions following the presentation may contain, forward-looking statements that reflect the intentions, beliefs or current expectations and projections of Signify N.V. (the “Company”, and together with its subsidiaries, the “Group”), including statements regarding strategy, estimates of sales growth and future operational results.
By their nature, these statements involve risks and uncertainties, and there may be many factors that could cause actual results or outcomes to differ materially from those expressed in or implied by these statements. These risks, uncertainties and other factors include macroeconomic developments, geopolitical volatility and related regulatory developments (including trade tariffs), supply shortages, commoditization, AI and digital disruption, execution risks in our enterprise resource planning transformation, insufficient talent and organizational capabilities currency risks, changes in international tax laws, cybersecurity risk, and increasing export controls, sanctions and trade restrictions.
The above risks may not include all factors that ultimately affect the Group. Additional risks and uncertainties that are currently not known to the Group or not considered material may have a material adverse effect on the business, strategy, results of operations, financial condition and prospects of the Group, or prevent the forward-looking events discussed from occurring. The Group undertakes no duty to and will not necessarily update any of the forward-looking statements in light of new information or future events, except to the extent required by applicable law.
Market and Industry Information
All references to market share, market data, industry statistics and industry forecasts in this document consist of estimates compiled by industry professionals, competitors, organizations or analysts, of publicly available information or of the Group’s own assessment of its sales and markets. Rankings are based on sales unless otherwise stated.
Non-IFRS Financial Measures
Certain parts of this document contain non-IFRS financial measures and ratios, such as comparable sales growth, adjusted gross margin and indirect costs, EBITA, adjusted EBITA, continuing net income, free cash flow, net debt, working capital, Brighter lives revenues, Circular revenues and other related ratios, which are not recognized measures of financial performance or liquidity under IFRS. The non-IFRS financial measures presented are measures used by management to monitor the underlying performance of the Group’s business and operations. Not all companies calculate non-IFRS financial measures in the same manner or on a consistent basis and these measures and ratios may not be comparable to measures used by other companies under the same or similar names. A reconciliation of a number of non-IFRS financial measures to the most directly comparable IFRS financial measures is contained in appendix B, Reconciliation of non-IFRS financial measures, of this document. For further information on non-IFRS financial measures, see “Chapter 18 Reconciliation of non-IFRS measures” in the Annual Report 2025. Presentation All amounts are in millions of euros unless otherwise stated. Due to rounding, amounts may not add up to totals provided. All reported data is unaudited. Unless otherwise indicated, financial information has been prepared in accordance with the accounting policies as stated in the Annual Report 2025, and the Semi-Annual Report 2026.
Market Abuse Regulation
This press release contains information within the meaning of Article 7(1) of the EU Market Abuse Regulation.
Appendix A – Financial statement information
A. Condensed consolidated statement of income
B. Condensed consolidated statement of comprehensive income
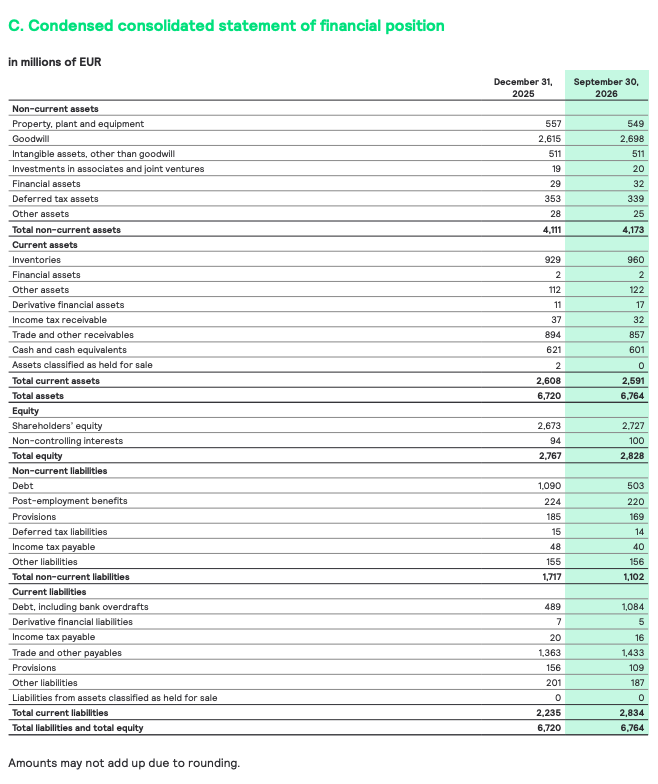
C. Condensed consolidated statement of financial position
D. Condensed consolidated statement of cash flows
Appendix B – Reconciliation of non-IFRS financial measures
Sales growth composition per business in %
Adjusted EBITA to Income from operations (or EBIT) in millions of EUR
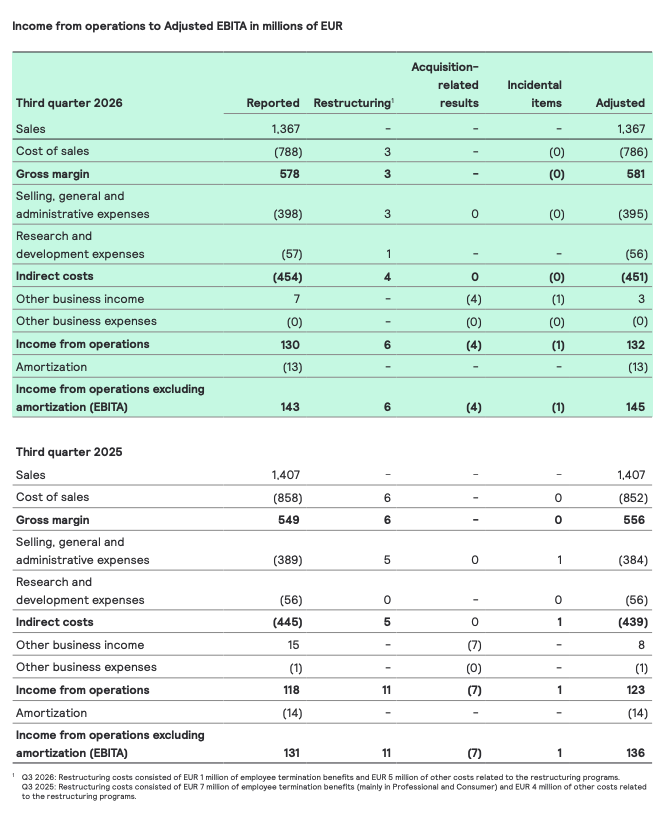
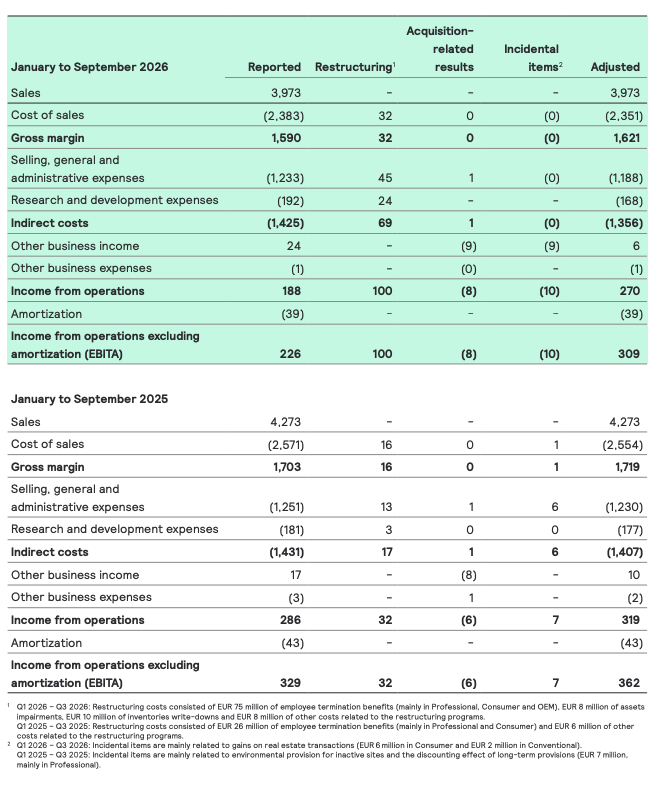
Income from operations to Adjusted EBITA in millions of EUR
Continuing net income to Net income attributable to shareholders of Signify N.V.
Appendix C – Financial glossary
Acquisition-related results
Results that are directly triggered by the acquisition of a company, such as transaction costs, purchase accounting related costs, integration related expenses, and releases of acquisition related provisions.
Adjusted EBITA
EBITA excluding restructuring costs, acquisition related results, and other incidental items.
Adjusted EBITA margin
Adjusted EBITA divided by sales to third parties (excluding intersegment). ‘Operational profitability’ also refers to this metric.
Adjusted gross margin
Gross margin, excluding restructuring costs, acquisition-related results, and other incidental items attributable to cost of sales.
Adjusted indirect costs
Indirect costs, excluding restructuring costs, acquisition-related results, and other incidental items attributable to indirect costs.
Adjusted R&D expenses
Research and development expenses, excluding restructuring costs, acquisition-related results, and other incidental items attributable to research and development expenses.
Adjusted SG&A expenses
Selling, general and administrative expenses, excluding restructuring costs, acquisition-related results, and other incidental items attributable to selling, general and administrative expenses.
Beyond illumination revenues
Percentage of total revenues coming from all products, systems and services contributing to Food availability, Safety & security, Health & well-being, and Solar solutions.
Comparable sales growth (CSG)
The period-on-period growth in sales excluding the effects of currency movements and changes in consolidation.
Consolidation effects
In the event a business is acquired (or divested), the impact of the consolidation (or deconsolidation) on the Group’s figures is included (or excluded) in the calculation of the comparable sales growth figures.
Continuing net income
Net income attributable to shareholders of Signify N.V. excluding restructuring costs, acquisitionrelated results, other incidental items, and discontinued operations.
Cumulative energy savings
Cumulative energy savings by our customers from sold LED products as replacement of conventional products.
Currency effects
Calculated by translating the foreign currency financials of the previous period and the current period into euros at the same average exchange rates.
EBIT
Income from operations.
EBITA
Income from operations excluding amortization and impairment of acquisition-related intangible assets and goodwill.
EBITDA
Income from operations excluding depreciation, amortization, and impairment of nonfinancial assets
Employees
Employees of Signify at the end of the period, expressed on a full-time equivalent (FTE) basis.
Free cash flow
Net cash provided by operating activities minus net capital expenditures. Free cash flow includes interest paid and income taxes paid.
Gross margin
Sales minus cost of sales.
Incidental items
Any item with an income statement impact (loss or gain) that is deemed to be both significant and not part of normal business activity. Other incidental items may extend over several quarters within the same financial year.
Indirect costs
The sum of selling, general and administrative expenses and R&D expenses.
Net capital expenditures
Additions of intangible assets, capital expenditures on property, plant and equipment and proceeds from disposal of property, plant and equipment.
Net debt
Short-term debt, long-term debt minus cash and cash equivalents.
Net leverage ratio
The ratio of consolidated reported net debt to consolidated reported EBITDA for the purpose of calculating the financial covenant.
Portfolio CO2 e emissions intensity reduction
Portfolio CO2 e emissions intensity reduction is measured as the annualized decrease in emissions intensity relative to the 2024 baseline year.
R&D expenses
Research and development expenses.
Restructuring costs
The estimated costs of initiated reorganizations which have been approved by the company and generally involve the realignment of certain parts of the organization. Restructuring costs include costs for employee termination benefits for affected employees and other costs directly attributable to the restructuring, such as impairment of assets and inventories.
SG&A expenses
Selling, general and administrative expenses.
Signify Circle Professional Europe revenues
Percentage of Professional Europe revenues coming from products classified as Signify Circle products, Light-as-a-service and remanufactured products, spare parts and upgrade kits.
Working capital
The sum of inventories, trade and other receivables (excluding insurance receivables for which a legal provision is recognized for the same amount), other current assets, derivative financial assets minus the sum of trade and other payables, derivative financial liabilities and other current liabilities (excluding share repurchase related payables and non-operating liabilities).
SourceSignify
EMR Analysis
More information on Signify: See the full profile on EMR Executive Services
More information on Jeroen Drost (Chairman of the Supervisory Board, Signify): See the full profile on EMR Executive Services
More information on As Tempelman (Member of the Board + Chief Executive Officer, Signify): See the full profile on EMR Executive Services
More information on Željko Kosanović (Member of the Board + Chief Financial Officer + Senior Vice President, Group Controller, Signify): See the full profile on EMR Executive Services
More information on Cooper Lighting Solutions by Signify: See the full profile on EMR Executive Services
More information on Kraig Kasler (President, Cooper Lighting Solutions, Signify): See the full profile on EMR Executive Services
More information on Nemalux by Cooper Lighting Solutions by Signify: See the full profile on EMR Executive Services
More information on Samuel Pogosian (Chief Executive Officer, Nemalux, Cooper Lighting Solutions, Signify): See the full profile on EMR Executive Services
More information on Genlyte Solutions by Signify: See the full profile on EMR Executive Services
More information on Christy Tilton (President, Genlyte, Signify + Member of the Board of Directors, NAED): See the full profile on EMR Executive Services
More information on Philips Lighting: https://www.lighting.philips.com/main/home + Philips is one of the world’s most trusted lighting brands. Since 1891, Philips has been synonymous with high-quality, reliable, innovative technology that improve people’s lives. The Philips brand is licensed to Signify, world leader in lighting, for lighting products and services. Philips is Signify’s primary brand for lamps, luminaires, and other lighting products for both professionals and consumers.
Signify products carrying the Philips brand cover the complete range of lighting applications, from home, office, and industry to street lighting, horticulture, sports, and more.
More information on Philips Hue by Philips Lighting: https://www.philips-hue.com/en-us + Philips Hue is the world leader in smart lighting. With its range of smart LED bulbs, light fixtures, lamps, sensors, and smart switches, Philips Hue brings smart lighting to everyday homes. The smart lighting system lets you set the mood with beautiful colors and Scenes, set up convenient timers and automations to help you feel safer in your surroundings, use the best light for your daily activities, and help make your life that much easier.
More information on Jasper Vervoort (General Manager, Philips Hue, Signify): See the full profile on EMR Executive Services
More information on John Smith (Business Leader, Philips Hue, Signify): See the full profile on EMR Executive Services
More information on the Sustainability Program (Brighter Lives, Better World 2030) + The Climate Transition Plan 2040 by Signify: See the full profile on EMR Executive Services
More information on Maurice Loosschilder (Head of Sustainability, Signify): See the full profile on EMR Executive Services
More information on EcoVadis: https://ecovadis.com + The World’s Most Trusted Business Sustainability Ratings.
Since its founding in 2007, EcoVadis has grown to become the world’s largest and most trusted provider of business sustainability ratings, creating a global network of more than 150,000+ rated companies.
Our team is composed of over 1900 highly-talented professionals from 80 nationalities.
The EcoVadis sustainability assessment methodology is at the heart of our Ratings and Scorecards and is an evaluation of how well a company has integrated the principles of Sustainability/CSR into their business and management system.
The EcoVadis sustainability assessment methodology is at the heart of our Ratings and Scorecards and is an evaluation of how well a company has integrated the principles of Sustainability/CSR into their business and management system.
Our methodology is built on international sustainability standards, including the Global Reporting Initiative, the United Nations Global Compact, and the ISO 26000, covering 250+ spend categories and 185+ countries. The Sustainability Scorecard illustrates performance across 21 indicators in four themes: Environment, Labor & Human Rights, Ethics and Sustainable Procurement.
EcoVadis medals are awarded to the top 35% of companies assessed by EcoVadis:
Medals are awarded based on the percentile rank of a company which is calculated at the time of scorecard publication. It compares a company’s performance with all rated companies in our database over the previous 12 months. The percentile rank is calculated across all companies in all industries, not per industry.
- Platinum – Top 1% (99+ percentile)
- Gold – Top 5% (95+ percentile)
- Silver – Top 15% (85+ percentile)
- Bronze – Top 35% (65+ percentile)
To be eligible for a medal, a company must achieve a minimum score of 30 in each of the four themes:
- Environment
- Ethics
- Labor & Human Rights
- Sustainable Procurement
More information on Pierre-François Thaler (Co-Founder & Co-Chief Executive Officer, EcoVadis + Co-Founder & Co-Chief Executive Officer, CyberVadis): https://ecovadis.com/leadership/ + https://www.linkedin.com/in/pfthaler/
More information on Frédéric Trinel (Co-Founder & Co-Chief Executive Officer, EcoVadis): https://ecovadis.com/leadership/
More information on Donald J. Trump (45th President, USA + 47th President, USA): https://www.whitehouse.gov/administration/donald-j-trump/ + https://www.donaldjtrump.com/
More information on the International Emergency Economic Powers Act of 1977 (IEEPA): https://www.govinfo.gov/content/pkg/STATUTE-91/pdf/STATUTE-91-Pg1625.pdf + https://www.congress.gov/crs-product/R45618 +
The International Emergency Economic Powers Act (IEEPA) provides the President broad authority to regulate a variety of economic transactions following a declaration of national emergency. IEEPA, like the Trading with the Enemy Act (TWEA) from which it branched, sits at the center of the modern U.S. sanctions regime. Changes in the use of IEEPA powers since the act’s enactment in 1977 have caused some to question whether the statute’s oversight provisions are robust enough given the sweeping economic powers it confers upon the President during a declared emergency.
Over the course of the twentieth century, Congress delegated increasing amounts of emergency power to the President by statute. TWEA was one such statute. Congress passed TWEA in 1917 to regulate international transactions with enemy powers following the U.S. entry into the First World War. Congress expanded the act during the 1930s to allow the President to declare a national emergency in times of peace and assume sweeping powers over both domestic and international transactions. Between 1945 and the early 1970s, TWEA became the central means to impose sanctions as part of U.S. Cold War strategy. Presidents used TWEA to block international financial transactions, seize U.S.-based assets held by foreign nationals, restrict exports, modify regulations to deter the hoarding of gold, limit foreign direct investment in U.S. companies, and impose tariffs on all imports into the United States.
Following committee investigations that discovered that the United States had been in a state of emergency for more than 40 years, Congress passed the National Emergencies Act (NEA) in 1976 and IEEPA in 1977. The pair of statutes placed new limits on presidential emergency powers. Both included reporting requirements to increase transparency and track costs, and the NEA required the President to assess annually and extend, if appropriate, an emergency. However, some experts argue that the renewal process has become pro forma. The NEA also afforded Congress the means to terminate a national emergency by adopting a concurrent resolution in each chamber. A decision by the Supreme Court, in a landmark case, however, found the use of concurrent resolutions to terminate an executive action unconstitutional. Congress amended the statute to require a joint resolution, significantly increasing the difficulty of terminating an emergency.
Like TWEA, IEEPA has become an important means to impose economic-based sanctions since its enactment; like TWEA, Presidents have frequently used IEEPA to restrict a variety of international transactions; and like TWEA, the subjects of the restrictions, the frequency of use, and the duration of emergencies have expanded over time. Initially, Presidents targeted foreign states or their governments. Over the years, however, presidential administrations have increasingly used IEEPA to target non-state individuals and groups, such as terrorists, persons who engage in malicious cyber-enabled activities, and certain persons associated with the International Criminal Court.
As of January 15, 2024, Presidents had declared 69 national emergencies invoking IEEPA, 39 of which are ongoing. History shows that national emergencies invoking IEEPA often last nearly a decade, although some have lasted significantly longer—the first state of emergency declared under the NEA and IEEPA, which was declared in response to the taking of U.S. embassy staff as hostages by Iran in 1979, is in its fifth decade.
IEEPA grants sweeping powers to the President to control economic transactions. Despite these broad powers, until 2023, Congress had never attempted to terminate a national emergency invoking IEEPA. Instead, Congress has directed the President on numerous occasions to use IEEPA authorities to impose sanctions. Congress may want to consider whether IEEPA appropriately balances the need for swift action in a time of crisis with Congress’s duty to oversee executive action. Congress may also want to consider IEEPA’s role in implementing its influence in U.S. foreign policy and national security decisionmaking.
New IEEPA Duty Refunds Page Now Available: U.S. Customs and Border Protection (CBP) is developing the Consolidated Administration and Processing of Entries (CAPE) functionality within the Automated Commercial Environment (ACE) to streamline the submission and processing of valid refund requests for duties imposed under the International Emergency Economic Powers Act (IEEPA), as authorized by court order or applicable law. For the latest guidance on eligibility, how to file through the CAPE system, and ACH enrollment requirements, visit our IEEPA Duty Refunds page International Emergency Economic Powers Act (IEEPA) Duty Refunds
This page is being maintained for reference purposes only. For refund information you should visit International Emergency Economic Powers Act (IEEPA) Duty Refunds
EMR Additional Financial Notes:
- Major financial KPI’s since 2017 are available on EMR Executive Services under “Financial Results” and comparison with peers under “Market Positioning”
- Companies’ full profile on EMR Executive Services are based on their official press releases, quarterly financial reports, annual reports and other official documents.
- All members of the Executive Committee and of the Board have their full profile on EMR Executive Services
- The Signify Q3 2026 Results Press release can be found here: https://www.signify.com/static/quarterlyresults/2026/q3_2026/signify-third-quarter-results-2026-report.pdf
- The Signify Q3 2026 Results Presentation can be found here: https://www.signify.com/static/quarterlyresults/2026/q3_2026/signify-third-quarter-results-2026-presentation.pdf
- The Signify Q3 2026 Results Analyst Consensus can be found here: https://www.signify.com/static/2026/20261008-signify-analyst-consensus-pre-q3-2026.pdf
- The Signify Q2 2026 Results Presentation can be found here: https://www.signify.com/static/quarterlyresults/2026/q2_2026/signify-second-quarter-results-2026-presentation.pdf
- The Signify Unaudited Condensed Consolidated Interim Financial Statements for the six-month period ended June 30, 2026 can be found here: https://www.signify.com/static/quarterlyresults/2026/q2_2026/signify-second-quarter-results-2026-report.pdf
- The Signify Q1 2026 Results Presentation can be found here: https://www.signify.com/static/quarterlyresults/2026/q1_2026/signify-first-quarter-results-2026-presentation.pdf
- The Signify Annual Report 2025 can be found here: https://www.signify.com/static/2025/signify-annual-report-2025.pdf
- The Signify Q4 2025 Results Report can be found here: https://www.signify.com/static/quarterlyresults/2025/q4_2025/signify-fourth-quarter-and-full-year-results-2025-report.pdf
- The Signify Q4 2025 Results Presentation can be found here: https://www.signify.com/static/quarterlyresults/2025/q4_2025/signify-fourth-quarter-and-full-year-results-2025-presentation.pdf
- The Signify Annual Report 2024 can be found here: https://www.signify.com/static/2024/signify-annual-report-2024.pdf
- The Signify Q4 and Full Year 2024 Results Report can be found here: https://www.signify.com/static/quarterlyresults/2024/q4_2024/signify-fourth-quarter-and-full-year-results-2024-report.pdf
- The Signify Q4 and Full Year 2024 Results Presentation can be found here: https://www.signify.com/static/quarterlyresults/2024/q4_2024/signify-fourth-quarter-and-full-year-results-2024-presentation.pdf
- The Signify comparable financials for 2023 and Q1 2024 following implementation of new organizational structure can be found here: https://www.assets.signify.com/is/content/Signify/Assets/signify/global/news/2024/20240614-signify-publishes-comparable-financials-for-2023-and-q1-2024.pdf
- The Signify Annual Report 2023 can be found here: https://www.signify.com/static/2022/signify-annual-report-2022.pdf
- The Signify Q4 and full-year results 2023 Report can be found here: https://www.signify.com/static/quarterlyresults/2023/q4_2023/signify-fourth-quarter-and-full-year-results-2023-report.pdf
- The Signify Q4 and full-year results 2023 Presentation can be found here: https://www.signify.com/static/quarterlyresults/2023/q4_2023/signify-fourth-quarter-and-full-year-results-2023-presentation.pdf
- The Signify Annual Report 2022 can be found here: https://www.signify.com/static/2022/signify-annual-report-2022.pdf
- The Signify Q4 2022 Presentation can be found here: https://www.signify.com/static/quarterlyresults/2022/q4_2022/signify-fourth-quarter-and-full-year-results-2022-presentation.pdf
- The Signify Business Highlights 2022 Video can be found here: https://www.signify.com/global/our-company/news/press-releases/2023/20230127-signify-fourth-quarter-and-full-year-results-2022