Orsted – Ørsted CEO Rasmus Errboe becomes Chair of WindEurope and calls for action on Europe’s competitiveness, energy security, and electrification


As Rasmus Errboe begins an 18-month term as Chair of WindEurope, he calls for Europe to turn its wind ambitions into action through more projects, stronger supply chains, accelerated electrification, and expanded grids.
Today, Rasmus Errboe, Group President and CEO of Ørsted, becomes Chair of WindEurope, the association representing the European wind industry and will be working alongside WindEurope CEO Tinne Van der Straeten to continue to advance the industry’s agenda.
His appointment comes as wind energy plays an increasingly important role in Europe’s competitiveness, energy security, affordability, and climate action.
Rasmus Errboe, Group President and CEO of Ørsted and Chair of WindEurope, says:
“Wind energy is key to addressing the challenges facing Europe. We need secure, renewable, and affordable energy that strengthens our competitiveness, supports jobs, and drives innovation. Europe has built a world-leading wind industry as part of the solution to these challenges. We now need to turn ambition into action by accelerating electrification, expanding our grids, and creating the right conditions for investment across Europe. As Chair, I look forward to working with policymakers and industry leaders to deliver the potential of wind for the benefit of Europe.”
Europe’s wind industry supports 480,000 jobs in Europe and provides home-grown renewable electricity to millions of households and businesses with wind energy generating around 20 % of the electricity consumed in Europe.
Europe is on track to install a record 24 GW of new wind capacity in 2026, equivalent to the annual electricity consumption of 20 million European households, a WindEurope analysis shows. But maintaining this momentum will require action. More projects need to move from targets to construction. That requires stronger supply chains, faster electrification, expanded grids, workable permitting and auction frameworks, and predictable conditions for long-term investment.
Tinne Van der Straeten, CEO of WindEurope, says:
“Rasmus Errboe takes over the WindEurope Chairmanship at a pivotal moment for Europe’s energy security and competitiveness. The wind industry is on track for another record year of wind installations, but it won’t sustain itself. Now is a critical time to address grid bottlenecks, kick-start electrification and secure coordinated auction volumes to keep investing. Rasmus brings industry knowledge and, above all, a clear understanding of what it takes to get wind projects built in Europe. Together with Vice-Chairman Salvatore Bernabei, they will provide strong leadership for the wind industry, committed to continuing to deliver for Europe’s energy security and resilience. I look forward to working together with them.”
Rasmus Errboe, Group President and CEO of Ørsted and Chair of WindEurope, says:
“As Chair, I want to help ensure that the industry speaks with a strong and united voice and that we work together across the entire value chain to remove barriers to deployment and unlock investment at greater scale. By bringing the sector together around our shared priorities, we can strengthen Europe’s wind industry and increase its contribution to our future.”
An Ørsted analysis shows that a renewables-based European energy system with wind at its core could reduce total European electricity system costs by up to 30 % by 2040.
As Chair, Rasmus Errboe will represent WindEurope’s full membership across the onshore and offshore wind value chain, including developers, manufacturers, suppliers, and national associations. He will chair meetings of WindEurope’s Board, which brings together senior executives from across the European wind industry, while helping to shape the association’s strategic direction and supporting its engagement with European policymakers and industry leaders as Europe advances its competitiveness, energy security, and decarbonisation goals.
SourceØrsted
EMR Analysis
More information on Ørsted: See the full profile on EMR Executive Services
More information on Rasmus Errboe (Group President and Chief Executive Officer, Ørsted + Chair, Management Committee, WindEurope): See the full profile on EMR Executive Services
More information on Trond Westlie (Group Executive Team – Executive Vice President, Chief Financial Officer, Ørsted): See the full profile on EMR Executive Services
More information on WindEurope: https://windeurope.org/ + WindEurope is the voice
of the wind industry. WindEurope is the non-profit association and voice of the wind industry in Europe. Representing 600+ members across the supply chain, we actively promote wind energy by driving policy influence, delivering market intelligence, facilitating business networking, and providing premier event and brand exposure.
More information on Rasmus Errboe (Group President and Chief Executive Officer, Ørsted + Chair, Management Committee, WindEurope): See the full profile on EMR Executive Services
More information on Salvatore Bernabei (Chief Executive Officer, Enel Green Power + Vice Chair, Management Committee, WindEurope): https://windeurope.org/about-us/board/#board + https://www.enelgreenpower.com/who-we-are/management-team + https://www.linkedin.com/in/salvatore-bernabei/
More information on Tinne Van der Straeten (Chief Executive Officer, WindEurope): https://windeurope.org/news/windeurope-appoints-tinne-van-der-straeten-as-new-ceo/ + https://windeurope.org/about-us/our-team/ + https://www.linkedin.com/in/tinnevanderstraeten/
More information on The European Union: https://european-union.europa.eu/index_en + The European Union’s institutional set-up is unique and its decision-making system is constantly evolving. The 7 European institutions, 7 EU bodies and over 30 decentralized agencies are spread across the EU. They work together to address the common interests of the EU and European people.
In terms of administration, there are a further 20 EU agencies and organisations which carry out specific legal functions and 4 interinstitutional services which support the institutions.
All of these establishments have specific roles – from developing EU laws and policy-making to implementing policies and working on specialist areas, such as health, medicine, transport and the environment.
There are 4 main decision-making institutions which lead the EU’s administration. These institutions collectively provide the EU with policy direction and play different roles in the law-making process:
- The European Parliament (Brussels/Strasbourg/Luxembourg)
- The European Council (Brussels)
- The Council of the European Union (Brussels/Luxembourg)
- The European Commission (Brussels/Luxembourg/Representations across the EU)
Their work is complemented by other institutions and bodies, which include:
- The Court of Justice of the European Union (Luxembourg)
- The European Central Bank (Frankfurt)
- The European Court of Auditors (Luxembourg)
The EU institutions and bodies cooperate extensively with the network of EU agencies and organisations across the European Union. The primary function of these bodies and agencies is to translate policies into realities on the ground.
Around 60,000 EU civil servants and other staff serve the 450 million Europeans (and countless others around the world).
Currently, 27 countries are part of the EU: https://european-union.europa.eu/principles-countries-history/country-profiles_en
More information on The European Commission by The European Union: https://ec.europa.eu/info/index_en + The Commission helps to shape the EU’s overall strategy, proposes new EU laws and policies, monitors their implementation and manages the EU budget. It also plays a significant role in supporting international development and delivering aid.
The Commission is steered by a group of 27 Commissioners, known as ‘the college’. Together they take decisions on the Commission’s political and strategic direction.
A new college of Commissioners is appointed every 5 years.
The Commission is organised into policy departments, known as Directorates-General (DGs), which are responsible for different policy areas. DGs develop, implement and manage EU policy, law, and funding programmes. In addition, service departments deal with particular administrative issues. Executive agencies manage programmes set up by the Commission.
Principal roles in law: The Commission proposes and implements laws which are in keeping with the objectives of the EU treaties. It encourages input from business and citizens in the law-making process and ensures laws are correctly implemented, evaluated and updated when needed.
More information on Ursula von der Leyen (President, The European Commission, The European Union): https://ec.europa.eu/commission/commissioners/2019-2024/president_en + https://www.linkedin.com/in/ursula-von-der-leyen/
EMR Additional Notes:
- Supply Chain:
- A supply chain is the end-to-end network of individuals, organizations, resources, activities, data, and technologies involved in the creation and delivery of a product or service—from raw materials to the final customer.
- A supply chain includes not only physical flows (goods), but also information flows and financial flows across all participants.
- At the most fundamental level, Supply Chain Management (SCM) is the integrated planning, coordination, and optimization of the flow of:
- goods
- information
- and finances
- from raw material sourcing to final delivery.
- At its core, SCM is not just “management of flows” but the optimization of those flows across cost, service level, speed, and risk.
- Supply Chain vs Logistics:
- Supply Chain: entire ecosystem (end-to-end)
- Logistics: subset focused on movement and storage of goods
- Grid, Microgrids, DERs and DERM’s:
- Grid / Power Grid:
- The power grid is a network for delivering electricity to consumers. The power grid includes power generation facilities, substations, transmission lines and towers, distribution networks, protection and control equipment, and associated communication and monitoring infrastructure.
- The grid continuously balances electricity generation and consumption while maintaining system stability and power quality, supplying electricity for applications ranging from industry to household appliances.
- Electric grids perform three major functions or stages of electricity supply: power generation, transmission, and distribution. Grid operation also includes functions such as system balancing, protection, control, monitoring, and, increasingly, energy storage and demand-side management.
- The power grid is a network for delivering electricity to consumers. The power grid includes power generation facilities, substations, transmission lines and towers, distribution networks, protection and control equipment, and associated communication and monitoring infrastructure.
- Microgrid:
- A microgrid is a group of interconnected loads and distributed energy resources (DERs) within clearly defined electrical boundaries that acts as a single controllable entity with respect to the main grid and can operate either connected to the main grid or, when appropriately designed, intentionally and controllably in an islanded mode.
- Microgrids can integrate local generation, energy storage, controllable loads, and other DERs to improve resilience, flexibility, efficiency, or local energy management.
- A microgrid is a group of interconnected loads and distributed energy resources (DERs) within clearly defined electrical boundaries that acts as a single controllable entity with respect to the main grid and can operate either connected to the main grid or, when appropriately designed, intentionally and controllably in an islanded mode.
- Smart Grid:
- A smart grid is an electrical grid enhanced with digital communications, sensing, automation, control, and data/analytics technologies across generation, transmission, distribution, and/or customer-side systems to improve the monitoring, operation, efficiency, reliability, resilience, and flexibility of the power system.
- Distributed Energy Resources (DERs):
- Distributed energy resources (DERs) are relatively small-scale electricity generation, storage, and flexible demand resources, located at or near the distribution system or customer premises, that can supply, store, or modify electricity consumption and are interconnected to the electric grid. They are often located close to load centers and can be used individually or in aggregate to provide value to the grid.
- Common examples of DERs include rooftop solar PV units, small wind turbines, small gas-fired generators or engines/turbines, microturbines, biomass generators, fuel cells, combined heat and power (CHP) or tri-generation systems with electrical generation, battery storage, electric vehicles and controllable EV charging or discharging where they can provide grid flexibility, and demand response applications.
- Distributed energy resources (DERs) are relatively small-scale electricity generation, storage, and flexible demand resources, located at or near the distribution system or customer premises, that can supply, store, or modify electricity consumption and are interconnected to the electric grid. They are often located close to load centers and can be used individually or in aggregate to provide value to the grid.
- Distributed Energy Resources Management Systems (DERMS):
- Distributed Energy Resources Management Systems (DERMS) are software platforms that help utilities, distribution system operators (DSOs), aggregators, and other energy-sector organizations monitor, provide visibility into, forecast, coordinate, optimize, and, where supported, control distributed energy resources (DERs).
- DERMS can be used to aggregate and coordinate large numbers of DERs and flexible loads for grid services, including voltage and power-flow management, congestion and constraint management, balancing, flexibility services, resilience, and participation in demand-response or other electricity markets. DERMS can be defined in many ways, depending on the use case, the types of DERs being managed, the responsibilities of the organization using the system, and the architecture of the power system.
- Distributed Energy Resources Management Systems (DERMS) are software platforms that help utilities, distribution system operators (DSOs), aggregators, and other energy-sector organizations monitor, provide visibility into, forecast, coordinate, optimize, and, where supported, control distributed energy resources (DERs).
- Grid / Power Grid:
- Fundamental Units of Electricity:
- Electric Current:
- Ampere – Amp (A):
- Amperes measure the flow of electrical current (electric charge) through a circuit. Ampere (A) is the SI unit of measure for the rate of electron flow, or current, in an electrical conductor.
- One ampere is defined as one coulomb of electric charge moving past a point in one second (1 A = 1 C/s). The ampere is named after the French physicist André-Marie Ampère, who made significant contributions to the study of electromagnetism.
- Milliampere (mA):
- Milliampere (mA) is a unit of electric current equal to one-thousandth of an ampere (1 mA = 0.001 A = 10⁻³ A). The prefix “milli” signifies 10⁻³ in the metric system. This unit is commonly used to measure small currents in electronic circuits and consumer devices.
- Ampere – Amp (A):
- Electrical Potential (Voltage):
- Volt (V):
- Volts measure the electric potential difference that drives the flow of electrons through a circuit. Voltage can be thought of as the “electrical pressure” that pushes current through a conductor.
- Kilovolt (kV):
- Kilovolt (kV) is a unit of potential difference equal to 1,000 volts (1 kV = 1,000 V).
- Volt (V):
- Electrical Power vs. Electrical Energy:
- Watts measure the rate of energy consumption or generation, also known as power.
- A useful analogy is:
- Power = the speed at which electricity is used or generated
- Energy = the total amount of electricity used or generated over time
- Power vs. Energy: how electricity is measured and billed.
- Power (measured in W, kW, MW, GW, TW): Rate at which energy is used or generated at a given moment.
- Energy (measured in Wh, kWh, MWh, GWh, TWh): Total amount of power consumed or generated over a period of time (Energy = Power × Time).
- Real Power Units:
- Real power units measure the actual (active) power that performs useful work.
- Kilowatt (kW):
- A kilowatt is simply a measure of how much power an electric appliance consumes—it’s 1,000 watts to be exact.
- You can quickly convert watts (W) to kilowatts (kW) by dividing your wattage by 1,000:
- 1,000 W = 1 kW
- Megawatt (MW):
- One megawatt equals one million watts or 1,000 kilowatts, roughly enough electricity for the instantaneous demand of approximately 500–1,000 homes (depending on region and consumption patterns).
- Gigawatt (GW):
- A gigawatt (GW) is a unit of power, and it is equal to one billion watts.
- According to the Department of Energy, generating one GW of power takes over three million solar panels or approximately 310 utility-scale wind turbines.
- Terawatt (TW):
- One terawatt is equal to one trillion watts (1,000,000,000,000 watts). The main use of terawatts is found in the electric power industry, particularly for measuring very large-scale power generation or consumption.
- According to the U.S. Energy Information Administration, America is one of the largest electricity consumers in the world, using about 4,146.2 terawatt-hours (TWh) of energy per year.
- Energy consumption should always be expressed in TWh (energy), not TW (power).
- Apparent Power Units:
- Apparent power measures the total electrical power supplied to an AC circuit, including both useful (real) power and non-working (reactive) power.
- Kilovolt-Amperes (kVA):
- Kilovolt-Amperes (kVA) stands for Kilo-volt-amperes, a term used for the rating of an electrical circuit. A kVA is a unit of apparent power, which is the product of the circuit’s voltage and current.
- The difference between real power (kW) and apparent power (kVA) is crucial.
- Real power (kW) is the actual power that performs work, while apparent power (kVA) is the total power delivered to a circuit, including the reactive power (measured in kVAR) that doesn’t perform useful work but is necessary to energize inductive equipment such as motors and transformers.
- The relationship between them is defined by the power factor.
- kW = kVA × Power Factor
- Since the power factor is typically less than 1, the kVA value will always be higher than the kW value.
- Megavolt-Amperes (MVA):
- Megavolt-Amperes (MVA) is a unit used to measure the apparent power in a circuit, primarily for very large electrical systems like power plants, substations, and transmission networks.
- 1 MVA is equivalent to:
- 1,000 kVA
- 1,000,000 VA
- Specialized Renewable Energy Unit:
- Kilowatt-peak (kWp):
- kWp stands for kilowatt-peak power output of a system. It is most commonly applied to solar photovoltaic (PV) systems.
- For example, a solar panel system with a peak power of 3 kWp working at its maximum capacity for one hour will produce up to 3 kWh.
- kWp (kilowatt peak) is the total kW rating of the system under Standard Test Conditions (STC).
- Example: If the system has four 270-watt panels: 4 × 0.27 kW = 1.08 kWp
- kWp does not universally correspond to 1,000 kWh/year; actual production depends strongly on location, irradiation, panel orientation, temperature, shading, and overall system efficiency (typically around 800–1,200 kWh/year per installed kWp in much of Europe).
- Kilowatt-peak (kWp):
- Electric Current:
- Carbon Dioxide (CO2):
- The primary greenhouse gas emitted through human activities. Carbon dioxide enters the atmosphere through the burning of fossil fuels (coal, natural gas, and oil), solid waste, biomass (e.g. wood), and also as a result of certain industrial chemical reactions (e.g. cement production).
- Carbon dioxide is removed from the atmosphere (or “sequestered”) when it is absorbed by plants as part of the biological carbon cycle and through ocean absorption and geological processes. In climate accounting, however, “carbon sequestration” generally refers to the removal and storage of carbon in a reservoir; natural uptake through the carbon cycle is not necessarily classified as anthropogenic carbon dioxide removal (CDR).
- CO₂ is naturally part of the carbon cycle, but human activities have significantly increased its concentration in the atmosphere.
- Biogenic Carbon Dioxide (CO2):
- Biogenic CO₂ and fossil-derived CO₂ are chemically identical molecules.
- The distinction is not chemical, but source-based:
- Biogenic carbon: CO₂ released from organic materials such as plants, wood, soil, and biomass that were recently part of the natural carbon cycle. Its accounting treatment depends on the applicable carbon-accounting methodology and whether the carbon is considered part of the contemporary biogenic carbon cycle.
- Fossil carbon: CO₂ released from fossil fuels (coal, oil, gas), which were stored underground for millions of years. This introduces additional carbon into the active atmospheric carbon cycle and is therefore generally treated as fossil CO₂ emissions.
- CO2e (Carbon Dioxide Equivalent):
- CO₂e means “carbon dioxide equivalent”.
- It is a standardized climate metric used to express the total climate impact of multiple greenhouse gases in a single standardized unit.
- CO₂e converts all greenhouse gases (such as methane and nitrous oxide) into the amount of CO₂ that would have the same integrated radiative forcing / climate impact over a defined time period using a specified Global Warming Potential (GWP) value.
- Formula: CO₂e = mass of gas × Global Warming Potential (GWP)
- Carbon dioxide equivalents are commonly expressed as million metric tonnes of carbon dioxide equivalents, abbreviated as MtCO₂e or Mt CO₂-eq; “MMTCDE” is used in some datasets but is not the preferred general notation.
- The carbon dioxide equivalent for a gas is derived by multiplying the tonnes of the gas by the associated GWP: CO₂e = mass of gas × GWP.
- For example, the GWP for methane is approximately 27–30 under IPCC AR6 depending on the methane source and accounting convention, while the 100-year GWP for nitrous oxide is 273. This means that emissions of 1 million metric tonnes of methane and nitrous oxide respectively would correspond to approximately 27–30 and 273 million metric tonnes of CO₂e under those GWP assumptions.
- Carbon Footprint:
- There is no universally agreed definition of what a carbon footprint is.
- The most widely used definition (GHG Protocol) describes it as: “The total set of greenhouse gas (GHG) emissions caused directly and indirectly through an organization’s operations and value chain.” The GHG Protocol generally refers to corporate GHG inventories and Scope 1, 2 and 3 emissions rather than prescribing one universal definition of “carbon footprint.”
- A carbon footprint is the total amount of greenhouse gas (GHG) emissions caused directly and indirectly by an individual, organization, product, or activity.
- It is typically measured in CO₂e.
- Decarbonization:
- Reduction of carbon dioxide emissions through the use of low-carbon energy sources and improved efficiency, with the goal of reducing overall greenhouse gas emissions. More broadly, decarbonization refers to reducing the carbon intensity and/or absolute greenhouse-gas emissions of an economy, sector, organization, product, or process, potentially including CO₂ removal for residual emissions.
- Decarbonization typically refers to system-wide transition, not only emission reduction at a single source.
- Carbon Credits or Carbon Offsets:
- Carbon credits are tradable certificates representing the verified reduction or removal of one metric tonne of CO₂e, generally generated by a specific project or activity; terminology and quality criteria vary between carbon markets.
- They are part of cap-and-trade systems, where:
- A cap limits total emissions
- Companies receive or buy emission allowances
- Excess allowances can be traded
- Offsets are often linked to external projects that reduce or remove emissions (e.g. reforestation, renewable energy). A carbon offset is generally a credit representing a reduction or removal outside the entity’s own emissions boundary that may be used to compensate for emissions, subject to the applicable programme or claim rules.
- Carbon credits and emission allowances should not be treated as synonymous: an allowance is a regulated authorization to emit under a cap-and-trade system, whereas a credit/offset generally represents a quantified emission reduction or removal.
- Carbon Capture and Storage (CCS) – Carbon Capture, Utilisation and Storage (CCUS):
- CCS involves capturing CO₂ emissions from industrial processes or other concentrated sources and storing them permanently in geological formations (e.g. underground reservoirs).
- CCUS adds a utilization step, where captured CO₂ is reused as a feedstock (e.g. fuels, chemicals, building materials). More precisely, CCUS refers to carbon capture followed by utilization and/or storage; utilization does not necessarily result in permanent carbon storage.
- CCS = capture + geological storage; CCUS = capture + utilization and/or storage.
- Carbon Dioxide Removal (CDR) or Durable Carbon Removal:
- CDR refers to methods that actively remove CO₂ from the atmosphere and store it for long periods in geological, biological, or mineral form. CDR specifically requires an anthropogenic activity that removes atmospheric CO₂ and durably stores it in geological, terrestrial, ocean, or product reservoirs.
- Examples include:
- Direct Air Capture (DAC)
- Bioenergy with Carbon Capture (BECCS)
- Enhanced Rock Weathering (ERW)
- CDR creates net negative emissions when removal exceeds emissions. A CDR activity itself can provide a net removal only when the total emissions associated with the removal process are lower than the amount of CO₂ durably removed and stored.
- Direct Air Capture (DAC):
- Technologies that extract CO2 directly from the atmosphere at any location, unlike carbon capture which is generally carried out at the point of emissions, such as a steel plant. DAC can capture CO₂ from ambient air regardless of where the original emissions occurred; it is distinct from point-source carbon capture.
- Constraints like costs and energy requirements as well as the potential for pollution make DAC a less desirable option for CO2 reduction. Its larger land footprint when compared to other mitigation strategies like carbon capture and storage systems (CCS) also put it at a disadvantage. However, DAC is a potential carbon-removal technology rather than simply a CO₂-reduction technology, and its climate benefit depends strongly on the energy source, capture efficiency, permanence of storage, and lifecycle emissions.
- Direct Air Capture and Storage (DACCS):
- Climate technology that removes carbon dioxide (CO2) directly from the ambient atmosphere using large fans and chemical processes to bind with the CO2. The captured CO₂ is then transported and durably stored, typically in geological formations.
- DACCS is therefore a specific form of CDR: DAC + durable CO₂ storage.
- Bioenergy with Carbon Capture and Storage (BECCS):
- Technology that generates energy from biomass while capturing and storing the resulting CO₂.
- Because biomass absorbs CO₂ while growing, BECCS can result in net negative emissions. It can result in net negative emissions when the full lifecycle emissions—including biomass production, harvesting, transport, processing, energy use, and capture/storage—are sufficiently lower than the amount of biogenic CO₂ durably removed from the atmosphere.
- Enhanced Rock Weathering (ERW):
- Carbon dioxide removal (CDR) technique that accelerates the natural process of rock weathering by grinding silicate rocks into dust and spreading it on land, typically agricultural fields. This process enhances reactions with water and atmospheric CO₂, converting dissolved carbon into bicarbonate and, ultimately, carbonate minerals or transporting dissolved inorganic carbon to aquatic systems, where it can be stored over long timescales.
- Its effectiveness and permanence depend on rock type, particle size, weathering rates, transport pathways, soil and water chemistry, and the emissions associated with mining, grinding, and transporting the rock.
- Limits of Carbon Dioxide Storage:
- Carbon storage is not endless; the Earth’s capacity for permanently storing vast amounts of captured carbon, particularly in geological formations, is limited, potentially reaching a critical limit of 1,460 gigatonnes at around 2200, though storage durations vary significantly depending on the method, from decades for some biological methods to potentially millions of years for others like mineralization. Estimates of geological storage capacity vary widely and depend on geology, reservoir characteristics, storage efficiency, infrastructure, economics, regulation, monitoring, and permanence.
- While some methods offer very long-term storage, the sheer volume needed to meet climate targets requires scaling up storage significantly beyond current capacity, raising concerns about the available volume over time. The practical constraint is therefore better described as the need to develop sufficient safe, permanent, economically and technically accessible storage capacity rather than a single known global physical limit.
- Carbon Impregnation:
- Carbon impregnation is the process of treating activated carbon with chemical agents (such as metals, acids, or bases) to enhance its ability to adsorb specific, hard-to-remove pollutants. By loading substances like silver, sulfur, or potassium hydroxide into its pores, this material combines physical adsorption with chemical reaction for improved, targeted filtration in water and air. This is a materials engineering process, not a climate accounting concept.
- Global Warming:
- Global warming is the long-term heating of Earth’s climate system observed since the pre-industrial period (between 1850 and 1900) due to human activities, primarily fossil fuel burning, which increases heat-trapping greenhouse gas levels in Earth’s atmosphere. Global warming refers specifically to the long-term increase in Earth’s average surface temperature; climate change is the broader term encompassing associated changes in climate systems, including precipitation, extremes, sea level, and ecosystems.
- Global Warming Potential (GWP):
- A measure of how much heat a greenhouse gas contributes to climate warming relative to CO₂ over a specific time period (commonly 100 years).
- CO₂ has a GWP of 1.
- GWP is the scientific basis for converting gases into CO₂e.
- GWP was developed to allow comparisons of the global warming impacts of different gases. The numerical GWP depends on the selected IPCC assessment, time horizon, and, for some gases such as methane, the emission source and accounting convention.
- Greenhouse Gas (GHG):
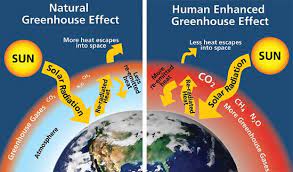
- Any gas that absorbs and emits infrared radiation in the atmosphere, contributing to the greenhouse effect.
- Main GHGs include:
- CO₂
- Methane (CH₄)
- Nitrous oxide (N₂O)
- Fluorinated gases such as HFCs, PFCs, SF₆ and NF₃
- Water vapor is a GHG but is not directly controlled by human emissions at scale. It is primarily a feedback in the climate system rather than a direct target of conventional anthropogenic GHG inventories.
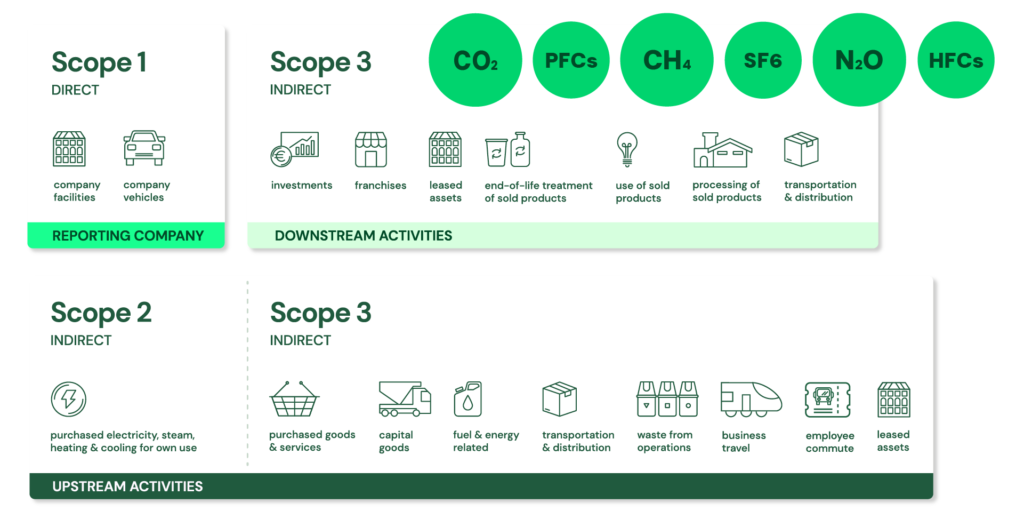
- GHG Protocol Corporate Standard Scope 1, 2 and 3: https://ghgprotocol.org/ + The GHG Protocol Corporate Accounting and Reporting Standard provides requirements and guidance for companies and other organizations preparing a corporate-level GHG emissions inventory. The Corporate Standard itself is voluntary, although companies may be required by applicable legislation or regulation to report using the GHG Protocol or equivalent requirements.
- Scope 1: Direct emissions:
- Direct emissions from company-owned and controlled resources. In other words, emissions are released into the atmosphere as a direct result of a set of activities, at a firm level. More precisely, Scope 1 covers direct GHG emissions from sources that are owned or controlled by the reporting organization.
- It is divided into four categories:
- Stationary combustion (e.g from fuels, heating sources). All fuels that produce GHG emissions must be included in scope 1. This applies when the combustion source is owned or controlled by the reporting organization.
- Mobile combustion is all vehicles owned or controlled by a firm, burning fuel (e.g. cars, vans, trucks). The increasing use of “electric” vehicles (EVs), means that some of the organisation’s fleets could fall into Scope 2 emissions. For example, fuel combustion in an owned/controlled vehicle is Scope 1, whereas electricity purchased to charge an EV is generally Scope 2; an EV itself does not create Scope 2 emissions—the purchased electricity does.
- Fugitive emissions are leaks from greenhouse gases (e.g. refrigeration, air conditioning units). It is important to note that refrigerant gases are not uniformly “a thousand times more dangerous” than CO₂; some refrigerants have GWPs of hundreds or thousands of times that of CO₂, while others have much lower values. Companies are encouraged to report these emissions.
- Process emissions are released during industrial processes, and on-site manufacturing (e.g. production of CO2 during cement manufacturing, factory fumes, chemicals). These are direct emissions resulting from physical or chemical processes other than fuel combustion, such as calcination in cement production..
- Scope 2: Indirect emissions – owned:
- Indirect emissions from the generation of purchased energy, from a utility provider. In other words, all GHG emissions released in the atmosphere, from the consumption of purchased electricity, steam, heat and cooling. Scope 2 covers indirect GHG emissions associated with the generation of purchased or acquired electricity, steam, heat, and cooling consumed by the reporting organization; “owned” is therefore misleading because the emissions source is owned or controlled by another entity.
- For most organisations, electricity will be the unique source of scope 2 emissions. Simply stated, the energy consumed falls into two scopes: Scope 2 covers the electricity consumed by the end-user. Scope 3 covers the energy used by the utilities during transmission and distribution (T&D) losses. More precisely, Scope 2 covers the generation-related emissions associated with purchased electricity, not the physical electricity itself. T&D losses are generally accounted for in Scope 3 Category 3 for an energy consumer that does not own the T&D system, although the treatment can vary depending on ownership and accounting circumstances.
- Scope 3: Indirect emissions – not owned:
- Indirect emissions – not included in scope 2 – that occur in the value chain of the reporting company, including both upstream and downstream emissions. In other words, emissions are linked to the company’s operations. According to the GHG protocol, scope 3 emissions are separated into 15 categories. Scope 3 therefore captures other indirect value-chain emissions, upstream and downstream, across the 15 defined categories of the Scope 3 Standard.
- Scope 1: Direct emissions: