Orsted – Borkum Riffgrund 3 enters commercial operation, strengthening Germany’s energy security with home-grown renewable power

Ørsted and Nuveen Infrastructure’s German offshore wind farm Borkum Riffgrund 3 has been commissioned and is now in commercial operation.
With an installed capacity of 913 MW, the project is one of Germany’s largest offshore wind farms currently in operation. The commissioning represents another major milestone in the delivery of Ørsted’s 8.1 GW construction programme as well as in Germany’s transition to home-grown renewable energy.
The offshore wind farm Borkum Riffgrund 3, jointly owned by Ørsted and Nuveen Infrastructure, is in commercial operation. With an installed capacity of 913 MW, Borkum Riffgrund 3 is one of Germany’s largest offshore wind farms currently in operation. The project demonstrates how large-scale offshore wind can strengthen energy security by delivering reliable, home-grown electricity to German industry and households.
Borkum Riffgrund 3 produces renewable energy at scale for German industrial and technology offtakers, underscoring the substantial demand for renewable energy in both the new digital economy as well as core industries such as chemicals. Furthermore, the project is advancing Ørsted’s 8.1 GW offshore wind construction programme, which will take the company to a total of more than 18 GW installed offshore wind capacity upon completion.
Borkum Riffgrund 3 is Ørsted’s sixth operational offshore wind farm in Germany, following the 253 MW Gode Wind 3 project, which was commissioned in early 2025 and is also jointly owned by Ørsted and Nuveen. Ørsted is Germany’s leading offshore wind operator, accounting for approximately 25 % of the country’s installed offshore wind capacity.
Nuveen Infrastructure is one of the largest infrastructure investment managers globally with over USD 40 billion in assets under management.
Patrick Harnett, Chief Construction Officer at Ørsted, said:
“With Borkum Riffgrund 3 now operational, we’ve delivered a landmark project for Germany and European offshore wind while making further progress on our 8.1 GW construction portfolio. The project demonstrates how offshore wind at scale can bolster energy security across Germany and Europe by powering businesses and homes. We remain committed to building out offshore wind in Germany and Europe, our core market. Stable and predictable regulatory frameworks are essential to enabling further offshore wind investments that can strengthen energy resilience and sustain jobs across Europe.”
Jordi Francesch, Global Head of Asset Management, Clean Energy at Nuveen Infrastructure, said:
“We’re proud to see Borkum Riffgrund 3 with an installed capacity of 913 MW reach commercial operation, marking the delivery of what will be one of Germany’s largest offshore wind farms in operation. Together with Ørsted and our long-term offtake partners, we’re providing clean electricity under a portfolio of long-dated corporate PPAs, supporting both industrial decarbonisation and long-term price visibility for consumers and businesses across Germany. This milestone further demonstrates Nuveen Infrastructure’s ability to develop and manage large and complex clean energy projects at scale and underlines our commitment to accelerating the EU energy transition while enhancing energy security for Germany and the wider region.”
Josche Muth, Country Manager for Ørsted Germany, said:
“Germany’s energy future won’t be built on fossil imports. It will be built on large-scale domestic renewable power. Borkum Riffgrund 3 is a clear example of how offshore wind can deliver secure, affordable, and home-grown electricity. With an installed capacity of 913 MW powering German industry today, Borkum Riffgrund 3 demonstrates what energy security looks like in practice.”
Felix Gschnell, Programme Director for Borkum Riffgrund 3 at Ørsted, said:
“The completion of Borkum Riffgrund 3 is a tremendous milestone for the offshore wind industry in Germany. It was a true collective effort by highly dedicated suppliers and an Ørsted project team, drawing on the company’s expertise and extensive experience in handling large-scale offshore wind projects. With our sixth wind farm now operational in the German North Sea, we further consolidate our market-leading position, while emphasising the true capabilities that offshore wind energy brings for advancing the German Energiewende.”
Powering the decarbonisation of German industry
Borkum Riffgrund 3 is supported by several long-term corporate power purchase agreements which Ørsted has signed with industrial and technology customers, thereby producing reliable power for data centres, retailers, and the chemical industry. Offtake agreements totalling 786 MW have been entered into with Amazon (350 MW), BASF (186 MW), Covestro (100 MW), Energie-Handels-Gesellschaft/REWE Group (100 MW), and Google (50 MW). The contracts range from 10 to 25 years in duration, contributing to German energy independence and security of supply.
European supply chain and local value creation
Borkum Riffgrund 3 is located about 72 km off the coast in the German North Sea and covers an area of approx. 75 km². A total of 83 wind turbines, each with a rated capacity of 11 MW, have been installed at the offshore wind farm. The project has mobilised a broad European supply chain, leveraging wind turbines and foundations from Germany and Denmark, cables from Germany and France, and installation vessels from the Netherlands and Belgium. About 100 German companies have been contracted for the construction of the wind farm.
With the addition of Borkum Riffgrund 3, Ørsted’s installed offshore wind power capacity in Germany increases to around 2.5 GW, enough to supply the equivalent of approx. 2.5 million households with renewable electricity. Operation and maintenance for the new wind farm and Ørsted’s existing German offshore wind portfolio is carried out from Norden-Norddeich and Emden, utilising the robust offshore wind infrastructure and network in Lower Saxony.
SourceØrsted
EMR Analysis
More information on Ørsted: See the full profile on EMR Executive Services
More information on Rasmus Errboe (Group President and Chief Executive Officer, Ørsted): See the full profile on EMR Executive Services
More information on Trond Westlie (Group Executive Team – Executive Vice President, Chief Financial Officer, Ørsted): See the full profile on EMR Executive Services
More information on Patrick Harnett (Group Executive Team – Executive Vice President, Chief Operating Officer, Ørsted): See the full profile on EMR Executive Services
More information on Josche Muth (Country Manager, Ørsted Germany, Ørsted): See the full profile on EMR Executive Services
More information on the Borkum Riffgrund 3 Offshore Wind Farm by Ørsted: https://orsted.de/gruene-energie/offshore-windenergie/unsere-offshore-windparks-nordsee/offshore-windpark-borkum-riffgrund-3 + With Borkum Riffgrund 3, we are building the largest offshore wind farm in Germany to date. We have already been awarded contracts for the original projects in the offshore wind tenders in 2017 and 2018 at a price of zero euros per MWh – a first for offshore wind.
- 913 MWInstalled capacity
- 8311 MW plants
- 900,000households supplied
- Located about 72 km off the coast in the German North Sea and covers an area of approx. 75 km².
- A total of 83 wind turbines, each with a rated capacity of 11 MW, have been installed at the offshore wind farm.
The wind farms Borkum Riffgrund West 1 (420 MW), Borkum Riffgrund West 2 (240 MW) and Northern Energy OWP West (240 MW) were merged in 2019 under the name Borkum Riffgrund 3. In autumn 2021, the Federal Maritime and Hydrographic Agency (BSH) granted official approval, the so-called plan approval, for Borkum Riffgrund 3.
More information on the Gode Wind 3 Offshore Wind Farm by Ørsted: https://orsted.de/gruene-energie/offshore-windenergie/unsere-offshore-windparks-nordsee/offshore-windpark-gode-wind-3 + We won the project rights for the Gode Wind 3 offshore wind farm in the 2017 and 2018 campaigns. The projects, originally defined as two offshore wind farms (Gode Wind 3 and 4), were merged by us into one project called Gode Wind 3 in 2019. Plan approval, i.e. the granting of official approval by the Federal Maritime and Hydrographic Agency (BSH), took place for the project in spring 2021. The final investment decision was made at the end of 2021.
The wind farm is being built approximately 32 kilometers off the island of Norderney and is 50 kilometers from our operations center in Norden-Norddeich . The spatial proximity to the Gode Wind 1 and 2 wind farms allows us to use synergies in the operation and maintenance of the wind farms. Construction is taking place in parallel with the Borkum Riffgrund 3 project .
More information on Felix Gschnell (Programme Director, Gode Wind 3 and Borkum Riffgrund 3, Ørsted): See the full profile on EMR Executive Services
More information on Nuveen: https://www.nuveen.com/en-us + Nuveen, a TIAA Company, is a global investment leader, managing $1.4T in public and private assets for clients around the world, as of June 30, 2026. With broad expertise across income and alternatives, we invest in the growth of businesses, real estate, infrastructure, and natural capital, providing clients with the reliability, access, and foresight unique to our 125+ year heritage. Our prevailing perspective on the future drives our ambition to innovate and adapt our business to the changing needs of investors — all to pursue lasting performance for our clients, our communities, and our global economy.
Nuveen’s infrastructure platform is dedicated solely to investing in private infrastructure assets and companies. Building on the firm’s long history of offering opportunities across a spectrum of difficult-to-access real asset classes — we invest across multiple strategies and sectors, including sustainable energy, digital, transportation, and social infrastructure. Our platform offers a diverse set of vehicles and customized strategies across equity and credit as well as deep expertise through an extensive operating partner network.
More information on William Huffman (Chief Executive Officer, Nuveen): https://www.nuveen.com/en-us/about-us/nuveen-leadership + https://www.linkedin.com/in/bill-huffman/
More information on Jordi Francesch (Head of Global Asset Management, Clean Energy, Nuveen Infrastructure, Nuveen): https://www.nuveen.com/global/about-us/profiles/f/jordi-francesch + https://www.linkedin.com/in/jordifrancesch/
More information on The European Union: https://european-union.europa.eu/index_en + The European Union’s institutional set-up is unique and its decision-making system is constantly evolving. The 7 European institutions, 7 EU bodies and over 30 decentralized agencies are spread across the EU. They work together to address the common interests of the EU and European people.
In terms of administration, there are a further 20 EU agencies and organisations which carry out specific legal functions and 4 interinstitutional services which support the institutions.
All of these establishments have specific roles – from developing EU laws and policy-making to implementing policies and working on specialist areas, such as health, medicine, transport and the environment.
There are 4 main decision-making institutions which lead the EU’s administration. These institutions collectively provide the EU with policy direction and play different roles in the law-making process:
- The European Parliament (Brussels/Strasbourg/Luxembourg)
- The European Council (Brussels)
- The Council of the European Union (Brussels/Luxembourg)
- The European Commission (Brussels/Luxembourg/Representations across the EU)
Their work is complemented by other institutions and bodies, which include:
- The Court of Justice of the European Union (Luxembourg)
- The European Central Bank (Frankfurt)
- The European Court of Auditors (Luxembourg)
The EU institutions and bodies cooperate extensively with the network of EU agencies and organisations across the European Union. The primary function of these bodies and agencies is to translate policies into realities on the ground.
Around 60,000 EU civil servants and other staff serve the 450 million Europeans (and countless others around the world).
Currently, 27 countries are part of the EU: https://european-union.europa.eu/principles-countries-history/country-profiles_en
More information on The European Commission by The European Union: https://ec.europa.eu/info/index_en + The Commission helps to shape the EU’s overall strategy, proposes new EU laws and policies, monitors their implementation and manages the EU budget. It also plays a significant role in supporting international development and delivering aid.
The Commission is steered by a group of 27 Commissioners, known as ‘the college’. Together they take decisions on the Commission’s political and strategic direction.
A new college of Commissioners is appointed every 5 years.
The Commission is organised into policy departments, known as Directorates-General (DGs), which are responsible for different policy areas. DGs develop, implement and manage EU policy, law, and funding programmes. In addition, service departments deal with particular administrative issues. Executive agencies manage programmes set up by the Commission.
Principal roles in law: The Commission proposes and implements laws which are in keeping with the objectives of the EU treaties. It encourages input from business and citizens in the law-making process and ensures laws are correctly implemented, evaluated and updated when needed.
More information on Ursula von der Leyen (President, The European Commission, The European Union): https://ec.europa.eu/commission/commissioners/2019-2024/president_en + https://www.linkedin.com/in/ursula-von-der-leyen/
More information on the Energiewende – Germany’s long-term strategy for the transition to renewable energy by 2050: https://energiewende.bundeswirtschaftsministerium.de/EWD/Redaktion/EN/Newsletter/2015/01/Meldung/topthema-the-energy-transition.html +
“Energiewende,” the energy transition, is Germany’s path to a secure, environmentally friendly and economically successful future. It is the decision to fundamentally reform our energy system: away from nuclear power, towards renewable energy sources. By the year 2050, 80 per cent of the country’s electricity is to come from renewable sources. At the same time, we want to halve energy consumption by using energy more sparingly and more efficiently and to reduce greenhouse gas emissions by 80-95 per cent. These are ambitious targets, but they are achievable.
The Energy Transition is based on two pillars. The first is the generation of more electricity from renewable sources: thanks to more than 20 years of government funding, green electricity is no longer a niche product but the the mainstay of Germany’s power supply. In 2014 the Renewable Energy Sources Act (EEG) was substantially reformed. On this new basis the expansion of the renewable energies will continue powerfully. But: it is being steered better and achieved with less expense. In parallel, the share of renewable energy in the heat market and in the transport sector, too, is to be increased further.
The second pillar is energy efficiency: in this context the Federal Government put forward an extensive work agenda, the National Action Plan on Energy Efficiency (NAPE) in December 2014. This comprises a large number of new and improved measures for using energy more efficiently. Here the principle is: “Supply information – Provide support – Demand action ” – in that order. Particularly great potentials for improving energy efficiency are present in the building sector. This is where almost 40 per cent of all final energy is consumed – mostly for heating and hot water. For that reason, the Federal Government has set itself the target of achieving a virtually climate-neutral building stock by the year 2050.
More information on Amazon: https://www.amazon.com + Amazon is guided by four principles: customer obsession rather than competitor focus, passion for invention, commitment to operational excellence, and long-term thinking. Amazon strives to be Earth’s Most Customer-Centric Company, Earth’s Best Employer, and Earth’s Safest Place to Work. Customer reviews, 1-Click shopping, personalized recommendations, Prime, Fulfillment by Amazon, AWS, Kindle Direct Publishing, Kindle, Career Choice, Fire tablets, Fire TV, Amazon Echo, Alexa, Just Walk Out technology, Amazon Studios, and The Climate Pledge are some of the things pioneered by Amazon.
More information on Jeffrey P. Bezos (Executive Chair, Amazon): See the full profile on EMR Executive Services
More information on Andy Jassy (President and Chief Executive Officer, Amazon): See the full profile on EMR Executive Services
More information on BASF: https://www.basf.com/global/en.html + At BASF, we create chemistry for a sustainable future. Our ambition: We want to be the preferred chemical company to enable our customers’ green transformation. We combine economic success with environmental protection and social responsibility. Around 95,000 employees in the BASF Group contribute to the success of our customers in nearly all sectors and almost every country in the world. Our portfolio comprises, as core businesses, the segments Chemicals, Materials, Industrial Solutions, and Nutrition & Care; our standalone businesses are bundled in the segments Surface Technologies and Agricultural Solutions. BASF generated sales of around €60 billion in 2025. BASF shares are traded on the stock exchange in Frankfurt (BAS) and as American Depositary Receipts (BASFY) in the United States.
More information on Dr. Markus Kamieth (Chairman of the Board of Executive Directors, BASF SE): https://www.basf.com/global/en/investors/basf-at-a-glance/corporate-governance/board-of-executive-directors.html + https://www.linkedin.com/in/markus-kamieth/
More information on Covestro: https://www.covestro.com/en + Covestro is one of the world’s leading manufacturers of high-quality polymer materials and their components. With its innovative products, processes and methods, the company helps enhance sustainability and the quality of life in many areas. Covestro supplies customers around the world in key industries such as mobility, building and living, as well as the electrical and electronics sector. In addition, polymers from Covestro are also used in sectors such as sports and leisure, telecommunications and health, as well as in the chemical industry itself.
The company is geared completely to the circular economy. In addition, Covestro aims to achieve climate neutrality for its Scope 1 and Scope 2 emissions by 2035, and the Group’s Scope 3 emissions are also set to be climate neutral by 2050. Covestro generated sales of EUR 12.9 billion in fiscal year 2025. At the end of 2025, the company had 46 production sites worldwide and employed approximately 17,600 people (calculated as full-time equivalents).
More information on Dr. Markus Steilemann (Chief Executive Officer, Covestro): https://www.covestro.com/en/company/management/board-of-management + https://www.linkedin.com/in/markussteilemann/
More information on REWE: https://www.rewe-group.com/en/ + The cooperatively organized REWE Group is one of the leading trade and tourism groups in Germany and Europe. In 2025, the company generated a total external turnover of more than 100 billion euros. Founded in 1927, REWE Group operates with around 380,000 employees in 21 European countries.
The sales lines include REWE, REWE CENTER, nahkauf and BILLA as well as ADEG supermarkets and consumer stores, the discounter PENNY, IKI, the drugstores BIPA and the toom Baumarkt DIY stores. The company also operates convenience stores REWE To Go, REWE express and the e-commerce activities REWE Liefer- and Abholservice as well as Zooroyal and Weinfreunde. The Lekkerland Group comprises the wholesale activities of the business group in the area of on-the-go consumption. Under the umbrella of DERTOUR Group, the Travel and Tourism division includes more than 2,000 travel agencies, tour operators as well as hotel brands and online travel portals.
More information on Lionel Souque (Chief Executive Officer, REWE): https://www.rewe-group.com/en/company/management-and-supervisory-board/ + https://www.linkedin.com/in/lionel-souque/
More information on Energie-Handels-Gesellschaft (EHA) by REWE Group: https://www.rewe-group.com/de/unternehmen/struktur-und-vertriebslinien/eha/ + https://www.eha.net/ + EHA Energie-Handels-Gesellschaft GmbH & Co. KG is an energy service provider for chain stores in Germany and Austria. EHA procures electricity and gas for its customers according to individual purchasing models. Its portfolio includes green electricity supply through Power Purchase Agreements (PPAs), on-site photovoltaic generation, and gas supply. Additional services include metering point operation, energy controlling, and data management. Furthermore, EHA offers security and alarm services under the EHA Security brand.
EHA’s customers are companies with multiple locations in industries such as retail, hospitality, logistics, and telecommunications.
Founded in 1998, EHA is a subsidiary of the REWE Group and also its central energy service provider. It employs around 100 people at its headquarters in Hamburg and another location in Cologne.
More information on Jan-Oliver Heidrich (Chief Executive Officer, Energie-Handels-Gesellschaft (EHA), REWE Group): https://www.eha.net/unternehmen.html + https://www.linkedin.com/in/jan-oliver-heidrich-722b02220/
More information on Google by Alphabet Inc.: https://abc.xyz/ + https://www.google.com/ + Our mission is to organize the world’s information and make it universally accessible and useful.
As our founders Larry and Sergey wrote in the original founders’ letter, “Google is not a conventional company. We do not intend to become one. That unconventional spirit has been a driving force throughout our history, inspiring us to tackle big problems and invest in moonshots like artificial intelligence (Al) research and quantum computing. We continue this work under the leadership of Sundar Pichai, who has served as CEO of Google since 2015 and as CEO of Alphabet since 2019.
Alphabet is a collection of businesses – the largest of which is Google. We report Google in two segments, Google Services and Soogle Cloud, we also report all non-Google businesses collectively as Other Bets. Other Bets include earlier stage technologies that are further afield from our core Google business. We take a long-term view and manage the portfolio of Other Bets with the discipline and rigor needed to deliver long-term returns. Alphabet’s structure is about helping each of our businesses prosper through strong leaders and independence.
The Internet is one of the world’s most powerful equalizers, it propels ideas, people and businesses large and small. Our mission to organize the world’s information and make it universally accessible and useful is as relevant today as it was when we were founded in 1998. Since then, we have evolved from a company that helps people find answers to a company that also helps people get things done.
More information on Sundar Pichai (Chief Executive Officer, Alphabet and Google): https://blog.google/authors/ + https://www.linkedin.com/in/sanaouji/
EMR Additional Notes:
- Commissioning:
- Commissioning ensures the system not only works but also works efficiently and effectively to meet its intended purpose. It is a quality assurance process that ensures a newly installed system is designed, installed, tested, and maintained to operate according to the owner’s requirements.
- Commissioning also verifies performance against design intent and operational requirements—not just functionality.
- It goes beyond a simple installation. Commissioning is a formal, documented process that involves several key steps:
- Pre-Installation
- Installation Verification.
- Functional Performance Testing.
- Documentation & Training.
- Handover & Ongoing Commissioning.
- Fundamental Units of Electricity:
- Electric Current:
- Ampere – Amp (A):
- Amperes measure the flow of electrical current (electric charge) through a circuit. Ampere (A) is the SI unit of measure for the rate of electron flow, or current, in an electrical conductor.
- One ampere is defined as one coulomb of electric charge moving past a point in one second (1 A = 1 C/s). The ampere is named after the French physicist André-Marie Ampère, who made significant contributions to the study of electromagnetism.
- Milliampere (mA):
- Milliampere (mA) is a unit of electric current equal to one-thousandth of an ampere (1 mA = 0.001 A = 10⁻³ A). The prefix “milli” signifies 10⁻³ in the metric system. This unit is commonly used to measure small currents in electronic circuits and consumer devices.
- Ampere – Amp (A):
- Electrical Potential (Voltage):
- Volt (V):
- Volts measure the electric potential difference that drives the flow of electrons through a circuit. Voltage can be thought of as the “electrical pressure” that pushes current through a conductor.
- Kilovolt (kV):
- Kilovolt (kV) is a unit of potential difference equal to 1,000 volts (1 kV = 1,000 V).
- Volt (V):
- Electrical Power vs. Electrical Energy:
- Watts measure the rate of energy consumption or generation, also known as power.
- A useful analogy is:
- Power = the speed at which electricity is used or generated
- Energy = the total amount of electricity used or generated over time
- Power vs. Energy: how electricity is measured and billed.
- Power (measured in W, kW, MW, GW, TW): Rate at which energy is used or generated at a given moment.
- Energy (measured in Wh, kWh, MWh, GWh, TWh): Total amount of power consumed or generated over a period of time (Energy = Power × Time).
- Real Power Units:
- Real power units measure the actual (active) power that performs useful work.
- Kilowatt (kW):
- A kilowatt is simply a measure of how much power an electric appliance consumes—it’s 1,000 watts to be exact.
- You can quickly convert watts (W) to kilowatts (kW) by dividing your wattage by 1,000:
- 1,000 W = 1 kW
- Megawatt (MW):
- One megawatt equals one million watts or 1,000 kilowatts, roughly enough electricity for the instantaneous demand of approximately 500–1,000 homes (depending on region and consumption patterns).
- Gigawatt (GW):
- A gigawatt (GW) is a unit of power, and it is equal to one billion watts.
- According to the Department of Energy, generating one GW of power takes over three million solar panels or approximately 310 utility-scale wind turbines.
- Terawatt (TW):
- One terawatt is equal to one trillion watts (1,000,000,000,000 watts). The main use of terawatts is found in the electric power industry, particularly for measuring very large-scale power generation or consumption.
- According to the U.S. Energy Information Administration, America is one of the largest electricity consumers in the world, using about 4,146.2 terawatt-hours (TWh) of energy per year.
- Energy consumption should always be expressed in TWh (energy), not TW (power).
- Apparent Power Units:
- Apparent power measures the total electrical power supplied to an AC circuit, including both useful (real) power and non-working (reactive) power.
- Kilovolt-Amperes (kVA):
- Kilovolt-Amperes (kVA) stands for Kilo-volt-amperes, a term used for the rating of an electrical circuit. A kVA is a unit of apparent power, which is the product of the circuit’s voltage and current.
- The difference between real power (kW) and apparent power (kVA) is crucial.
- Real power (kW) is the actual power that performs work, while apparent power (kVA) is the total power delivered to a circuit, including the reactive power (measured in kVAR) that doesn’t perform useful work but is necessary to energize inductive equipment such as motors and transformers.
- The relationship between them is defined by the power factor.
- kW = kVA × Power Factor
- Since the power factor is typically less than 1, the kVA value will always be higher than the kW value.
- Megavolt-Amperes (MVA):
- Megavolt-Amperes (MVA) is a unit used to measure the apparent power in a circuit, primarily for very large electrical systems like power plants, substations, and transmission networks.
- 1 MVA is equivalent to:
- 1,000 kVA
- 1,000,000 VA
- Specialized Renewable Energy Unit:
- Kilowatt-peak (kWp):
- kWp stands for kilowatt-peak power output of a system. It is most commonly applied to solar photovoltaic (PV) systems.
- For example, a solar panel system with a peak power of 3 kWp working at its maximum capacity for one hour will produce up to 3 kWh.
- kWp (kilowatt peak) is the total kW rating of the system under Standard Test Conditions (STC).
- Example: If the system has four 270-watt panels: 4 × 0.27 kW = 1.08 kWp
- kWp does not universally correspond to 1,000 kWh/year; actual production depends strongly on location, irradiation, panel orientation, temperature, shading, and overall system efficiency (typically around 800–1,200 kWh/year per installed kWp in much of Europe).
- Kilowatt-peak (kWp):
- Electric Current:
- Power Purchase Agreements (PPAs):
- A Power Purchase Agreement (PPA) is a long-term contract for the sale and purchase of electricity between a power producer (seller) and an offtaker (buyer), such as a utility, corporate, or energy trader. A PPA is a risk allocation and revenue-stabilization contract that enables electricity to be sold at pre-agreed terms over a defined period (typically 10–25 years). PPAs are a key enabler of renewable energy project financing (“bankability”), as they provide predictable cash flows required by lenders and investors. In many markets, PPAs have replaced feed-in tariffs as the primary mechanism for financing new renewable capacity.
- It defines key commercial terms, including:
- electricity volume
- pricing structure
- delivery conditions
- contract duration
- penalties and settlement mechanisms
- Electricity under a PPA is either physically delivered (Physical PPA) or financially settled (Virtual/Synthetic PPA), not “supplied on a balancing sheet.”
- Physical PPA → actual delivery of electricity to the buyer
- Virtual / Financial PPA (VPPA) → financial contract for differences (CfD), electricity sold on the market but price hedged between parties
- Carbon Dioxide (CO2):
- The primary greenhouse gas emitted through human activities. Carbon dioxide enters the atmosphere through the burning of fossil fuels (coal, natural gas, and oil), solid waste, biomass (e.g. wood), and also as a result of certain industrial chemical reactions (e.g. cement production).
- Carbon dioxide is removed from the atmosphere (or “sequestered”) when it is absorbed by plants as part of the biological carbon cycle and through ocean absorption and geological processes. In climate accounting, however, “carbon sequestration” generally refers to the removal and storage of carbon in a reservoir; natural uptake through the carbon cycle is not necessarily classified as anthropogenic carbon dioxide removal (CDR).
- CO₂ is naturally part of the carbon cycle, but human activities have significantly increased its concentration in the atmosphere.
- Biogenic Carbon Dioxide (CO2):
- Biogenic CO₂ and fossil-derived CO₂ are chemically identical molecules.
- The distinction is not chemical, but source-based:
- Biogenic carbon: CO₂ released from organic materials such as plants, wood, soil, and biomass that were recently part of the natural carbon cycle. Its accounting treatment depends on the applicable carbon-accounting methodology and whether the carbon is considered part of the contemporary biogenic carbon cycle.
- Fossil carbon: CO₂ released from fossil fuels (coal, oil, gas), which were stored underground for millions of years. This introduces additional carbon into the active atmospheric carbon cycle and is therefore generally treated as fossil CO₂ emissions.
- CO2e (Carbon Dioxide Equivalent):
- CO₂e means “carbon dioxide equivalent”.
- It is a standardized climate metric used to express the total climate impact of multiple greenhouse gases in a single standardized unit.
- CO₂e converts all greenhouse gases (such as methane and nitrous oxide) into the amount of CO₂ that would have the same integrated radiative forcing / climate impact over a defined time period using a specified Global Warming Potential (GWP) value.
- Formula: CO₂e = mass of gas × Global Warming Potential (GWP)
- Carbon dioxide equivalents are commonly expressed as million metric tonnes of carbon dioxide equivalents, abbreviated as MtCO₂e or Mt CO₂-eq; “MMTCDE” is used in some datasets but is not the preferred general notation.
- The carbon dioxide equivalent for a gas is derived by multiplying the tonnes of the gas by the associated GWP: CO₂e = mass of gas × GWP.
- For example, the GWP for methane is approximately 27–30 under IPCC AR6 depending on the methane source and accounting convention, while the 100-year GWP for nitrous oxide is 273. This means that emissions of 1 million metric tonnes of methane and nitrous oxide respectively would correspond to approximately 27–30 and 273 million metric tonnes of CO₂e under those GWP assumptions.
- Carbon Footprint:
- There is no universally agreed definition of what a carbon footprint is.
- The most widely used definition (GHG Protocol) describes it as: “The total set of greenhouse gas (GHG) emissions caused directly and indirectly through an organization’s operations and value chain.” The GHG Protocol generally refers to corporate GHG inventories and Scope 1, 2 and 3 emissions rather than prescribing one universal definition of “carbon footprint.”
- A carbon footprint is the total amount of greenhouse gas (GHG) emissions caused directly and indirectly by an individual, organization, product, or activity.
- It is typically measured in CO₂e.
- Decarbonization:
- Reduction of carbon dioxide emissions through the use of low-carbon energy sources and improved efficiency, with the goal of reducing overall greenhouse gas emissions. More broadly, decarbonization refers to reducing the carbon intensity and/or absolute greenhouse-gas emissions of an economy, sector, organization, product, or process, potentially including CO₂ removal for residual emissions.
- Decarbonization typically refers to system-wide transition, not only emission reduction at a single source.
- Carbon Credits or Carbon Offsets:
- Carbon credits are tradable certificates representing the verified reduction or removal of one metric tonne of CO₂e, generally generated by a specific project or activity; terminology and quality criteria vary between carbon markets.
- They are part of cap-and-trade systems, where:
- A cap limits total emissions
- Companies receive or buy emission allowances
- Excess allowances can be traded
- Offsets are often linked to external projects that reduce or remove emissions (e.g. reforestation, renewable energy). A carbon offset is generally a credit representing a reduction or removal outside the entity’s own emissions boundary that may be used to compensate for emissions, subject to the applicable programme or claim rules.
- Carbon credits and emission allowances should not be treated as synonymous: an allowance is a regulated authorization to emit under a cap-and-trade system, whereas a credit/offset generally represents a quantified emission reduction or removal.
- Carbon Capture and Storage (CCS) – Carbon Capture, Utilisation and Storage (CCUS):
- CCS involves capturing CO₂ emissions from industrial processes or other concentrated sources and storing them permanently in geological formations (e.g. underground reservoirs).
- CCUS adds a utilization step, where captured CO₂ is reused as a feedstock (e.g. fuels, chemicals, building materials). More precisely, CCUS refers to carbon capture followed by utilization and/or storage; utilization does not necessarily result in permanent carbon storage.
- CCS = capture + geological storage; CCUS = capture + utilization and/or storage.
- Carbon Dioxide Removal (CDR) or Durable Carbon Removal:
- CDR refers to methods that actively remove CO₂ from the atmosphere and store it for long periods in geological, biological, or mineral form. CDR specifically requires an anthropogenic activity that removes atmospheric CO₂ and durably stores it in geological, terrestrial, ocean, or product reservoirs.
- Examples include:
- Direct Air Capture (DAC)
- Bioenergy with Carbon Capture (BECCS)
- Enhanced Rock Weathering (ERW)
- CDR creates net negative emissions when removal exceeds emissions. A CDR activity itself can provide a net removal only when the total emissions associated with the removal process are lower than the amount of CO₂ durably removed and stored.
- Direct Air Capture (DAC):
- Technologies that extract CO2 directly from the atmosphere at any location, unlike carbon capture which is generally carried out at the point of emissions, such as a steel plant. DAC can capture CO₂ from ambient air regardless of where the original emissions occurred; it is distinct from point-source carbon capture.
- Constraints like costs and energy requirements as well as the potential for pollution make DAC a less desirable option for CO2 reduction. Its larger land footprint when compared to other mitigation strategies like carbon capture and storage systems (CCS) also put it at a disadvantage. However, DAC is a potential carbon-removal technology rather than simply a CO₂-reduction technology, and its climate benefit depends strongly on the energy source, capture efficiency, permanence of storage, and lifecycle emissions.
- Direct Air Capture and Storage (DACCS):
- Climate technology that removes carbon dioxide (CO2) directly from the ambient atmosphere using large fans and chemical processes to bind with the CO2. The captured CO₂ is then transported and durably stored, typically in geological formations.
- DACCS is therefore a specific form of CDR: DAC + durable CO₂ storage.
- Bioenergy with Carbon Capture and Storage (BECCS):
- Technology that generates energy from biomass while capturing and storing the resulting CO₂.
- Because biomass absorbs CO₂ while growing, BECCS can result in net negative emissions. It can result in net negative emissions when the full lifecycle emissions—including biomass production, harvesting, transport, processing, energy use, and capture/storage—are sufficiently lower than the amount of biogenic CO₂ durably removed from the atmosphere.
- Enhanced Rock Weathering (ERW):
- Carbon dioxide removal (CDR) technique that accelerates the natural process of rock weathering by grinding silicate rocks into dust and spreading it on land, typically agricultural fields. This process enhances reactions with water and atmospheric CO₂, converting dissolved carbon into bicarbonate and, ultimately, carbonate minerals or transporting dissolved inorganic carbon to aquatic systems, where it can be stored over long timescales.
- Its effectiveness and permanence depend on rock type, particle size, weathering rates, transport pathways, soil and water chemistry, and the emissions associated with mining, grinding, and transporting the rock.
- Limits of Carbon Dioxide Storage:
- Carbon storage is not endless; the Earth’s capacity for permanently storing vast amounts of captured carbon, particularly in geological formations, is limited, potentially reaching a critical limit of 1,460 gigatonnes at around 2200, though storage durations vary significantly depending on the method, from decades for some biological methods to potentially millions of years for others like mineralization. Estimates of geological storage capacity vary widely and depend on geology, reservoir characteristics, storage efficiency, infrastructure, economics, regulation, monitoring, and permanence.
- While some methods offer very long-term storage, the sheer volume needed to meet climate targets requires scaling up storage significantly beyond current capacity, raising concerns about the available volume over time. The practical constraint is therefore better described as the need to develop sufficient safe, permanent, economically and technically accessible storage capacity rather than a single known global physical limit.
- Carbon Impregnation:
- Carbon impregnation is the process of treating activated carbon with chemical agents (such as metals, acids, or bases) to enhance its ability to adsorb specific, hard-to-remove pollutants. By loading substances like silver, sulfur, or potassium hydroxide into its pores, this material combines physical adsorption with chemical reaction for improved, targeted filtration in water and air. This is a materials engineering process, not a climate accounting concept.
- Global Warming:
- Global warming is the long-term heating of Earth’s climate system observed since the pre-industrial period (between 1850 and 1900) due to human activities, primarily fossil fuel burning, which increases heat-trapping greenhouse gas levels in Earth’s atmosphere. Global warming refers specifically to the long-term increase in Earth’s average surface temperature; climate change is the broader term encompassing associated changes in climate systems, including precipitation, extremes, sea level, and ecosystems.
- Global Warming Potential (GWP):
- A measure of how much heat a greenhouse gas contributes to climate warming relative to CO₂ over a specific time period (commonly 100 years).
- CO₂ has a GWP of 1.
- GWP is the scientific basis for converting gases into CO₂e.
- GWP was developed to allow comparisons of the global warming impacts of different gases. The numerical GWP depends on the selected IPCC assessment, time horizon, and, for some gases such as methane, the emission source and accounting convention.
- Greenhouse Gas (GHG):
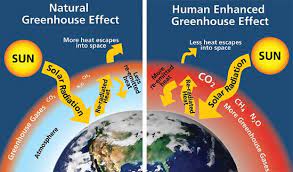
- Any gas that absorbs and emits infrared radiation in the atmosphere, contributing to the greenhouse effect.
- Main GHGs include:
- CO₂
- Methane (CH₄)
- Nitrous oxide (N₂O)
- Fluorinated gases such as HFCs, PFCs, SF₆ and NF₃
- Water vapor is a GHG but is not directly controlled by human emissions at scale. It is primarily a feedback in the climate system rather than a direct target of conventional anthropogenic GHG inventories.
- GHG Protocol Corporate Standard Scope 1, 2 and 3: https://ghgprotocol.org/ + The GHG Protocol Corporate Accounting and Reporting Standard provides requirements and guidance for companies and other organizations preparing a corporate-level GHG emissions inventory. The Corporate Standard itself is voluntary, although companies may be required by applicable legislation or regulation to report using the GHG Protocol or equivalent requirements.
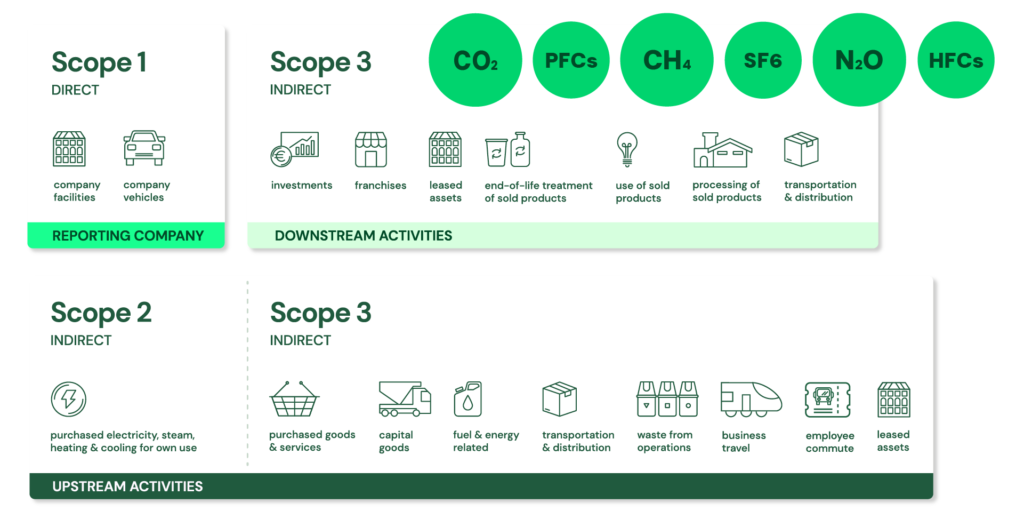
- Scope 1: Direct emissions:
- Direct emissions from company-owned and controlled resources. In other words, emissions are released into the atmosphere as a direct result of a set of activities, at a firm level. More precisely, Scope 1 covers direct GHG emissions from sources that are owned or controlled by the reporting organization.
- It is divided into four categories:
- Stationary combustion (e.g from fuels, heating sources). All fuels that produce GHG emissions must be included in scope 1. This applies when the combustion source is owned or controlled by the reporting organization.
- Mobile combustion is all vehicles owned or controlled by a firm, burning fuel (e.g. cars, vans, trucks). The increasing use of “electric” vehicles (EVs), means that some of the organisation’s fleets could fall into Scope 2 emissions. For example, fuel combustion in an owned/controlled vehicle is Scope 1, whereas electricity purchased to charge an EV is generally Scope 2; an EV itself does not create Scope 2 emissions—the purchased electricity does.
- Fugitive emissions are leaks from greenhouse gases (e.g. refrigeration, air conditioning units). It is important to note that refrigerant gases are not uniformly “a thousand times more dangerous” than CO₂; some refrigerants have GWPs of hundreds or thousands of times that of CO₂, while others have much lower values. Companies are encouraged to report these emissions.
- Process emissions are released during industrial processes, and on-site manufacturing (e.g. production of CO2 during cement manufacturing, factory fumes, chemicals). These are direct emissions resulting from physical or chemical processes other than fuel combustion, such as calcination in cement production..
- Scope 2: Indirect emissions – owned:
- Indirect emissions from the generation of purchased energy, from a utility provider. In other words, all GHG emissions released in the atmosphere, from the consumption of purchased electricity, steam, heat and cooling. Scope 2 covers indirect GHG emissions associated with the generation of purchased or acquired electricity, steam, heat, and cooling consumed by the reporting organization; “owned” is therefore misleading because the emissions source is owned or controlled by another entity.
- For most organisations, electricity will be the unique source of scope 2 emissions. Simply stated, the energy consumed falls into two scopes: Scope 2 covers the electricity consumed by the end-user. Scope 3 covers the energy used by the utilities during transmission and distribution (T&D) losses. More precisely, Scope 2 covers the generation-related emissions associated with purchased electricity, not the physical electricity itself. T&D losses are generally accounted for in Scope 3 Category 3 for an energy consumer that does not own the T&D system, although the treatment can vary depending on ownership and accounting circumstances.
- Scope 3: Indirect emissions – not owned:
- Indirect emissions – not included in scope 2 – that occur in the value chain of the reporting company, including both upstream and downstream emissions. In other words, emissions are linked to the company’s operations. According to the GHG protocol, scope 3 emissions are separated into 15 categories. Scope 3 therefore captures other indirect value-chain emissions, upstream and downstream, across the 15 defined categories of the Scope 3 Standard.
- Scope 1: Direct emissions:
- Supply Chain:
- A supply chain is the end-to-end network of individuals, organizations, resources, activities, data, and technologies involved in the creation and delivery of a product or service—from raw materials to the final customer.
- A supply chain includes not only physical flows (goods), but also information flows and financial flows across all participants.
- At the most fundamental level, Supply Chain Management (SCM) is the integrated planning, coordination, and optimization of the flow of:
- goods
- information
- and finances
- from raw material sourcing to final delivery.
- At its core, SCM is not just “management of flows” but the optimization of those flows across cost, service level, speed, and risk.
- Supply Chain vs Logistics:
- Supply Chain: entire ecosystem (end-to-end)
- Logistics: subset focused on movement and storage of goods