RS Group – Full-year results (year ended 31 March 2026)
RS Group plc results for the full year ended 31 March 2026
Resilient full year performance; good underlying progress
SIMON PRYCE, CHIEF EXECUTIVE OFFICER, COMMENTED: “2025/26 was another year of strong execution of our multi-year plan to improve the business and deliver on the significant value creation opportunity at RS. Revenue was broadly flat in challenging markets, but we gained share with most major suppliers and saw stronger momentum in the second half, particularly in Asia Pacific and US & Canada, with EMEA also returning to growth. Our growth accelerators outperformed the wider Group and good price discipline led to improved gross margin. Better execution, cost discipline and cash focus also supported operating profit and cash conversion ahead of expectations.
A number of our investments in customer-facing data, systems and processes are now moving into activation, positioning the business for accelerated growth, supported by ongoing investment in people, customer experience, supply chain efficiency and operational excellence. Whilst conscious of the wider macro environment, we enter 2026/27 with building momentum and the potential to enhance our organic growth strategy with disciplined and value creative acquisitions, such as the £30 million acquisition of BPX completed in March.
Two years of positive underlying progress, combined with disciplined cost control and a clear plan, increases our confidence in delivering our medium-term financial targets and sustainable returns. Excellent cash generation and a very strong balance sheet gives us more than sufficient capacity to execute our organic investment programme enhanced by value creative acquisitions. In line with our disciplined approach to capital structure and allocation we are therefore also launching today a £100 million share buyback programme.”
2025/26 financial performance; momentum in the second half
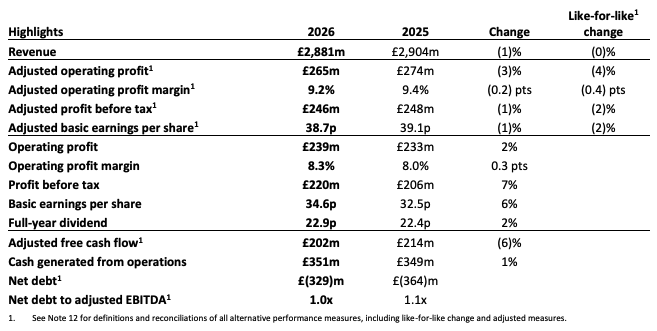
- Group revenue down 1%; like-for-like broadly flat.
- Building momentum in all regions, good growth in Asia Pacific and US & Canada, EMEA returning to growth in the second half, Mexico short-term challenges.
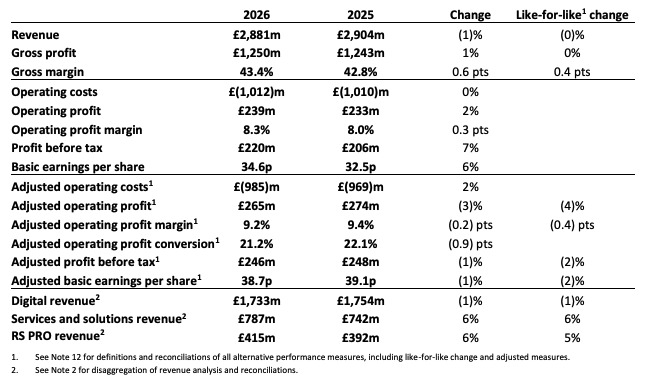
- Gross margin improved by 0.6 percentage points to 43.4% driven by pricing and active inventory management.
- Adjusted operating margin flat at 9.2% (H2: 9.7%); cost inflation and targeted higher organic investment partly offset by cost savings.
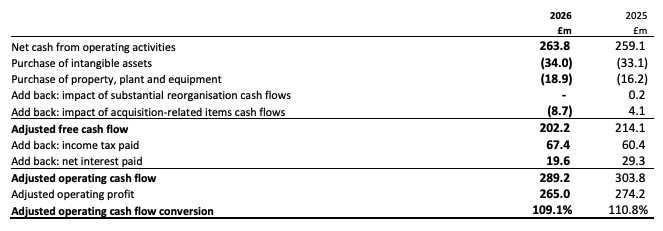
- Adjusted operating cash flow conversion of 109% (2024/25: 111%), significantly exceeding our 80% target.
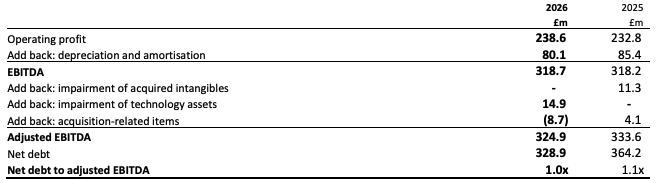
- Very strong balance sheet, net debt to adjusted EBITDA of 1.0x.
- Attractive shareholder returns with dividend up 2% to 14.2 pence per share and launch of a £100 million share buyback over 12 months.
Further strategic and operational progress in 2025/26
- Growth accelerators delivering; RS PRO like-for-like revenue up 5% and services and solutions up 6%.
- Distrelec integration largely complete, delivering more than £40 million of synergy benefits, ahead of plan.
- £17 million cost savings delivered, total of £55 million integration and restructuring benefits since April 2023.
- £35 million of in-year strategic organic investment; strengthening our operating platform.
Outlook
We made good progress in 2025/26 and PMIs1 are trending positively. With our ongoing investment and greater agility, we see improving momentum into 2026/27 and most of our major markets are now back into low single digit growth. We remain mindful of geopolitical and economic developments and conflicts in the Middle East and Ukraine and the potential impact they might have on global supply chains, industrial production and customer behaviour. However, the investments we are making are delivering tangible benefits, strengthening our proposition and positioning us well to capture growth and further increase market share as end-markets recover. This, together with improved delivery and operating leverage and disciplined cost control, supports the Group’s increasing confidence in delivering our medium-term financial targets of growing revenue at twice the market, mid-teen adjusted operating margins, cash conversion over 80%, and over 20% return on capital employed.
1. Purchasing Managers’ Index (PMI).
Company compiled consensus for the year ending 31 March 2026 has revenue of £2,873 million, adjusted operating profit of £265 million and adjusted profit before tax of £244 million. Source: https://www.rsgroup.com/investors/analyst-consensus/.
There will be an audio presentation today at 9am (UK time) which can be accessed live and later as a recording on the RS Group website at www.rsgroup.com.
Webcast link: https://webcast.openbriefing.com/rsgroup-fy2526/
It is advisable to pre-register early to avoid any delays in joining the conference call. To ask a question, participants will need to be connected by phone.
Participant dial-in numbers
United Kingdom (Local): +44 20 3936 2999
United Kingdom (Toll-Free): +44 808 189 0158
All other locations: Global Dial-In Numbers
Participant access code: 526283
Presentation timing
Date: Wednesday, 20 May 2026
Time: 9am UK time
BUSINESS REVIEW
We made further strategic and operational progress over the year. Group like-for-like revenue was broadly flat despite more challenging than anticipated markets, particularly in first half. However, PMI data showed improvement throughout the year and moved into expansion territory in the fourth quarter. This was reflected in improved sales momentum, particularly in Q4. Whilst volumes were marginally below our expectations, good price discipline resulted in improved gross margin for the full year, with our growth accelerators of RS PRO and services and solutions delivering growth ahead of the rest of the Group. We also saw improved execution which, with continued cost discipline and cash focus, led to operating profit and cash conversion marginally ahead of expectations despite softer revenue than planned.
Investment in our strategic initiatives will accelerate growth, improve efficiency and drive stronger operating leverage over time. We are already seeing improvements in key operational metrics, together with gross margin progression in the second half and continued traction in our digital procurement services, demonstrating that our growth accelerators are delivering. We also achieved a further £17 million of restructuring and integration benefits in 2025/26, taking the cumulative total since April 2023 to £55 million
With a stronger platform, improving momentum and enhanced operating leverage, we are well-positioned to capture growth, drive further market share gains and deliver sustainable, long-term value as our end-markets continue to recover. Whilst at this stage we remain cautious on the outlook and mindful of developments in the Middle East, our progress strengthens our confidence in both our strategy and our ability to deliver on our medium-term financial targets.
2025/26 Resilient financial performance
We delivered a resilient financial performance for the full year 2025/26. Group like-for-like revenue was broadly flat (down 1% on a reported basis) compared with the same period last year. After a difficult first half, EMEA saw an improving revenue trend through the remainder of the year and moved back into growth in Q4. Americas was also down on a like-for-like basis, with a resilient performance in US & Canada offset by ongoing economic and political uncertainty leading to major project delays in Mexico. Asia Pacific delivered good revenue growth throughout the year.
With continued investment in our front-end systems and a commercial focus to grow potential high value customers, we saw rolling 12 months average order value increase by 5% to £276 and a 6% like-for-like revenue growth in larger corporate customers. Our services and solutions growth accelerators also performed well, growing 6% with our eProcurement solution growing 9% like-for-like. Our own brand RS PRO products outperformed with 5% like-for-like growth. At a product category level, the more resilient product categories of Facilities & Maintenance and Mechanical & Fluid Power continue to outperform. Americas, excluding Latin America, delivered further Automation & Control (A&C) and Electrification revenue growth. Semis & Passives returned to growth in Americas and Asia Pacific
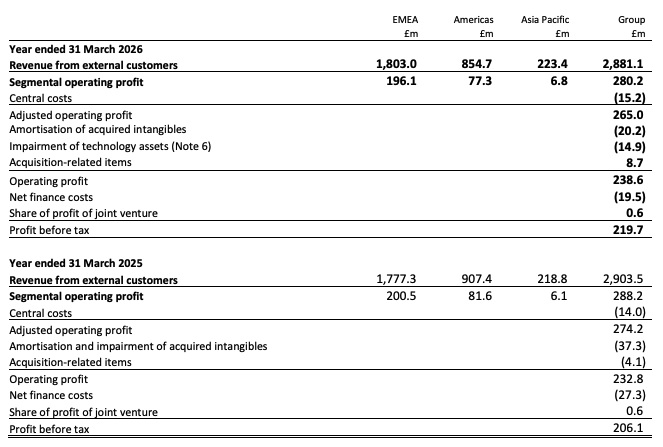
Group gross margin increased 0.6 percentage points to 43.4%, or 0.4 percentage points on a like-for-like basis. The improvement was driven by active pricing optimisation and stronger growth in higher-margin product categories. Adjusted operating costs were up 2%, with restructuring savings and focused cost management helping to offset the impact of cost inflation and continued strategic investment. Adjusted operating profit of £265 million was 3% lower than the same period last year, or 4% lower on a like-for-like basis, with margins broadly stable at 9.2%.
Continued good working capital management resulted in adjusted operating cash flow conversion of 109%, well in excess of our minimum 80% target. Net debt fell by £35 million over the year to £329 million, and our balance sheet remains strong, with net debt to adjusted EBITDA reducing to 1.0x.
Strategic and operational investment delivering
We continue to progress with our multi-year strategic growth and operational improvement plan to strengthen our differentiated proposition, accelerate growth, improve efficiency, and drive better operating leverage over time. These organic investments are driving improvement in our key underlying operational metrics, improving resilience and supporting delivery in our growth accelerators.
Acquisitions
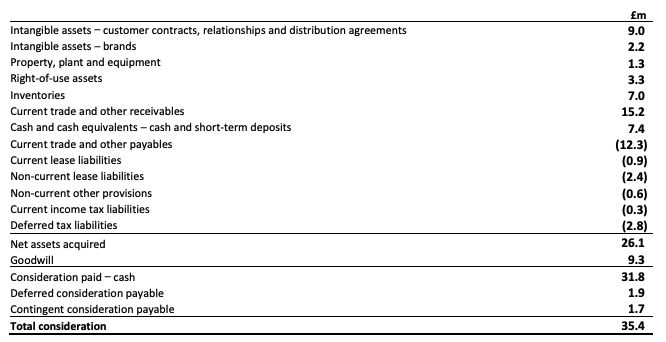
We continue to enhance our organic growth strategy with disciplined and value creative acquisitions. In March 2026 we acquired BPX Group, a UK and Ireland based specialist distributor of industrial automation and control products, for an Enterprise Value (cash-free debt-free) of £27 million and a deferred earn-out of up to £3 million, payable subject to achievement of agreed EBITDA performance targets. The consideration represents an acquisition multiple of around 10x reported EBIT on a 12-month basis to 31 October 2025. BPX Group, founded more than 50 years ago, specialises in supporting industrial customers with technical A&C solutions in UK and Ireland. The acquisition complements our strengths in A&C and enhances our technical capabilities and high-service focus. It also expands our relationship with key suppliers and under RS ownership we see the opportunity for BPX to accelerate revenue growth through offering enhanced products and capabilities to complementary customers.
People
Create an inclusive and engaging environment where everyone is proud and excited to come to work and can perform at their best, develop and thrive.
Our people are central to delivering the strategic and change ambitions outlined at our 2024 Investor Event. To support execution, we have further strengthened our executive and leadership capability with the appointment of Jonathan Bennett as President, Americas, and Lee Pruitt as Chief Customer Experience Officer. Both bring deep industry expertise and proven leadership experience, to drive growth and enhance our customer proposition.
We are also investing in developing our people and addressing the changing skill and capability needed to deliver our strategy in a rapidly evolving world. Our Leadership Advantage development programme, launched in 2025/26 in partnership with a world-renowned business school, is the first of its type at RS, aimed at enhancing the capabilities of 90 senior leaders and potential leaders across the globe. We have also commenced our future skills planning process, ‘skills@RS’ to acquire or develop enhanced capability across the Group in areas such as data and data analytics, AI development, adoption and use, and support accelerated individual development.
We have continued to focus on maintaining and improving engagement at all levels by listening to our employees and then following up on actions. Our recent employee engagement survey showed a 3 point year-on-year increase with an engagement score of 75 points. As already communicated at the half year, we have also recognised the contribution of our employees below senior leadership level through the introduction of an all-employee share scheme with the aim of driving further engagement and shared ownership.
Customers
Focus on higher value customers through harnessing data, effective strategic engagement, and optimising cost to serve.
We continue to focus on increasing our share of wallet with customers who have high value potential in attractive industry verticals. We are unlocking this through data-driven insights and targeted omnichannel engagement, enabling a more personalised customer experience with optimised cost to serve.
In 2025/26 we completed the design and build of our global customer data master platform, providing a unified view of customers globally. This has enabled us to build potential-based segmentation of customers and are now deploying these capabilities across our major markets in EMEA and Americas. During the year, we also completed the global rollout of the Customer Relationship Manager (CRM) which is now being integrated with our Customer Data Platform (CDP), which will ultimately enable always-on, intelligent and behaviour-led engagement across the customer lifecycle.
Early results are encouraging with improving conversion rates when utilising the personalised web journeys through our CDP. Through the CRM system, our sales teams have been able to capture better quality leads by leveraging richer customer insights which will drive higher conversion rates and larger deal opportunities. This has helped us better target our high potential value customers contributing to a 6% like-for-like revenue growth from our Corporate customer segment during the year. The data flow between these platforms will be increasingly automated and tuned through 2026/27.
Product and suppliers
Deliver a seamless, mutually value creative supplier experience with appropriate and data driven breadth, depth and range curation.
Our upgraded Product Management Solution, launched last year, removed system constraints and enabled faster and more targeted management of our curated product range. Enhanced localisation and product information capabilities, supported by 20 million product attributes, are improving customer experience and searchability. Monthly new product introductions (NPI) capacity increased by 5 times to more than 50,000 in 2025/26. The platform also supports more efficient inventory management with over 185,000 new products launched as non-stocked items to assess demand and inform stocking decisions.
RS PRO, the professional-quality own brand of RS, continues to outperform with 5% growth through 2025/26 exceeding 14% share of Group revenue at year end and further enhancing its attractive margin position. It has been a record year for new products introduced to our RS PRO range – enabled by the investment in our product management solution – with 10,000 products added, a 45% increase on 2024/25.
We continue to invest in our enhanced pricing capability, which has benefited the Group while navigating persistent global trade uncertainty, including the impact of tariffs. Most notably in North America, where through improved execution-led pricing discipline and leveraging of our AI-enabled pricing tools, we managed 3 times more targeted price actions during 2025/26. This supported more consistent alignment to cost and market dynamics to give us greater flexibility in support of both suppliers and customers.
Services and solutions
Deliver valued, scalable solutions to build greater strategic engagement and drive product pull-through.
We continue to scale our solutions offer which had like-for-like revenue growth of 6% during the year and now contributes 27% of Group revenue. Enhancing and scaling our digital procurement solutions remains a focus, with eProcurement like-for-like revenue growth of 9% during the year, reflecting our deepening relationships with our higher value customers.
During 2025/26, we continued to refocus RS Integrated Supply (RSIS) which offers supply chain and procurement services to large, multi-site industrial businesses, and increased investment in our proprietary Maintenance, Repair & Operations (MRO) management platform and on-site capabilities. RSIS materially accelerated its digital innovation including enhancement to RS SYNC™ Mobile which integrates product identification, classification and real-time inventory visibility across a curated marketplace of 24 million products, improving procurement efficiency and automation for customers. In 2025/26 RS Integrated Supply like-for-like revenue was flat, but like-for-like operating profit increased by 29% alongside improved working capital management. Continued collaboration with the rest of the Group, including RS PRO, provides increased access to RS products for RSIS customers’ MRO spend, while ensuring the independence that is important for other RSIS suppliers.
Experience
Strengthen and tailor our customer experience to provide a digitally enabled, seamless omnichannel service relevant for our customers’ needs.
The design of our enhanced and digitally enabled omnichannel customer experience is largely complete, and the major foundational investments that enable it are well advanced. We completed the rollout of our AI-enabled web search capabilities, and began integrating it with an upgraded digital commerce platform which we launched in US & Canada. This provides improved functionality, personalisation and data capture to enhance the customer journey. We continue to tune this Adobe-based commerce engine to enhance it further and are now testing it in EMEA in advance of launching it on country-by-country basis commencing in Q4 2026/27.
Our deliver-to-promise capability – which provides accurate, reliable, real-time availability and delivery information to our customers across EMEA & Asia Pacific – was completed in the second half of the year. Introducing improved delivery information earlier in the customer’s online journey has resulted in an improved browsing experience and 4% average order uplift from early online stock visibility. The implementation of AI-enabled web search capabilities in 2024/25 continues to deliver improved ‘findability’ across our ranges, which resulted in a 28% increase in the ‘Add to Cart’ rate. The new Basket & Checkout experience, completed in the first half, has improved basket to order conversion rate up from 39% to 42%.
Operational excellence
Deliver efficient physical, digital and process infrastructure, improved operating leverage and marginal drop-through.
To ensure we are well positioned for growth, we continue to invest in our distribution network. Through 2025/26 we made significant progress on the build of upgraded facilities in Italy and Ireland and started installation of a state-ofthe-art robotic process automation in Italy which will become the standard for all our regional distribution centres. The upgrade of our UK automated Warehouse Management System (WMS) continues, with the final phase planned for 2026/27 before a phased rollout of a market-leading WMS solution across all of our distribution sites in the coming years.
The integration of Distrelec is largely complete with the migration of their Netherlands distribution centre to our Bad Hersfeld facility in Germany at the end of June ahead of schedule. This will save us more than €10 million from reduced annual costs and deliver increased operational gearing through the use of existing infrastructure as part of the wider integration that has delivered synergies well ahead of the acquisition case despite challenging markets impacting revenue performance.
Simplification of our technology estate continues. To date we have removed more than 100 applications and continue to see further opportunities for consolidation, enabling further savings that will allow the business to absorb increased licence-costs as a result of the market shift to a ‘software as a service’ technology model.
We have optimised the flow through our distribution network removing non-value-add activities and reducing the number of times a product is handled. This has resulted in a 50% increase in our supply chain efficiency ratio and an improvement in our cost to serve.
Preparation for the upgrade of our Enterprise Resource Planning (ERP) system continues and is on track for first rollout across our EMEA markets.
Driving sustainable growth and stronger value creation
While we continue to deliver our 2030 ESG action plan, For a Better World, ESG is increasingly shaping customer and product sourcing decisions, strengthening supplier relationships and supporting the long-term resilience and performance of the Group. We have maintained Platinum EcoVadis status for the fourth consecutive year and achieved a CDP A List rating for the second year, reinforcing trust in our commitment, transparency and action and helping to differentiate the RS brand with high value customers and strategic suppliers. Our Better World product range comprises more than 33,000 products from over 165 suppliers across 30 countries. Underpinned by an industry standard, claims-based framework, it enables customers to make more sustainable choices while improving efficiency and reducing costs.
Alongside this, we continue to drive efficiencies across our operations and logistics to reduce cost and carbon, while improving customer experience. Since 2019/20, Scope 1 and 2 emissions have reduced by 67%, keeping us on track to deliver our science based target of a 75% reduction by 2030. Our product transport emissions intensity has reduced by 34% since 2019/20, and we have now extended our 2030 target to 40% (previously 35%). During the year we set a new, more ambitious and holistic Scope 3 target to reduce Scope 3 GHG emissions by 51.6% per £ million value added by 2029/30 from a 2019/20 base year, which has been validated by the Science Based Targets initiative.
Confidence in long-term value creation
Our performance in the year and the strong underlying progress in the second half gives us confidence that RS Group is:
- Well positioned in fragmented markets which have attractive through cycle growth characteristics;
- Driving market share gains through a differentiated technical and digital product and services and solutions offer;
- Investing to improve efficiency and operating leverage of global infrastructure to drive significant margin expansion;
- Pursuing disciplined acquisition opportunities to accelerate growth, subject to our key criteria of strategic fit, value accretion and successful integration; and
- Targeting the creation of significant and sustainable value for stakeholders.
We remain active at looking at acquisition opportunities across our markets, with a solid pipeline of opportunities that can accelerate our strategy in a value disciplined way, supported by our strong balance sheet. Selective acquisitions can enhance our presence in key markets, accelerate our operating leverage, strengthen product specialisation and expand our services and solutions portfolio. We will remain value disciplined in the way we assess opportunities.
The Group’s focus on cash generation has also resulted in a strong balance sheet with leverage at the bottom end of our target range 1.0-2.0x net debt to adjusted EBITDA. We therefore, as part of our disciplined approach to capital structure and allocation, are today commencing a £100 million share buyback programme. We also recommend a 2% increase in the 2025/26 dividend, consistent with a progressive dividend policy, and we’ll continue to review acquisition opportunities.
This progress underpins our confidence in delivering on our medium-term financial targets of revenue growth of twice our market, mid-teen adjusted operating margin, cash conversion of over 80% and a sustainable return on capital of more than 20%.
GROUP FINANCIAL PERFORMANCE
Revenue
Group revenue of £2,881 million was down 1% compared to 2024/25. After adjusting for adverse exchange rate movements, largely related to a weakening of the US dollar compared to last year, fewer trading days in 2025/26, and the revenue related to the acquisition of BPX, like-for-like revenue was flat. Group revenue was flat in the second half, an improvement on the first half decline of 1%, supported by the acceleration in growth across EMEA, Asia Pacific and Americas (with the exception of Mexico).
Regional revenue, gross margin and operating profit is provided in the Regional Performance section below.
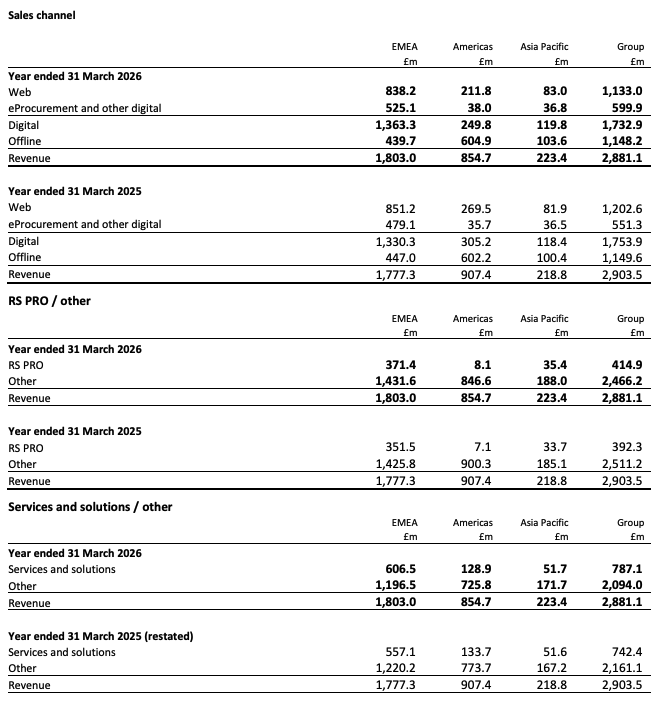
Digital revenue, accounting for 60% of Group revenue (of which 65% is web revenue and 27% is procurement solutions such as eProcurement), reduced 1% on a like-for-like basis. Web revenue, which tends to reflect smaller, more transactional purchases decreased 6% like-for-like. This was mainly a result of the impact on web revenue in Americas due to the digital platform upgrade and the integration of Distrelec in the DACH region, with the decommissioning of certain products impacting our customer attrition as anticipated.
Services and solutions revenue, accounting for 27% of Group revenue, increased by 6% like-for-like, reflecting the increased use of eProcurement and a continuation of strong performance in maintenance, rental, technical and design solutions. RS Integrated Supply revenue was broadly flat on a like-for-like basis.
RS PRO, which is our main own brand product range and accounts for 14% of Group revenue (21% share of EMEA revenue, 1% of Americas, 16% of Asia Pacific), grew by 5% like-for-like. These results are supported by the extension our product breadth and an end-to-end sales and marketing focus in all our regions. Our competitively priced range continues to resonate as a quality, non-competing alternative to third-party branded products, reinforced by our proven quality assurance qualifications and design and testing facilities.
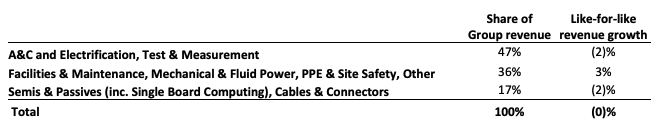
Consistent with trends seen over the past couple of years, revenue performance by product category demonstrates the difference between categories that are more industrial and tend to be less volatile (Facilities & Maintenance, Mechanical & Fluid Power, PPE & Site Safety) and those correlated to the electronics market (such as A&C and Electrification) and the more electronics specific categories, Semi & Passives and Cables & Connectors.
Gross margin
Group gross margin increased by 0.6 percentage points to 43.4%, or by 0.4 percentage points on a like-for-like basis. The improvement was driven by active pricing optimisation and stronger growth in higher margin product categories, particularly Facilities and Maintenance and Mechanical and Fluid Power. In the second half, gross margin increased further to 43.7%, reflecting favourable pricing, alongside supply chain and commercial initiatives that improved inventory management, and changes to provisioning rates.
Operating costs
Reported operating costs were flat year-on-year and remained stable at 35% of revenue. On an adjusted basis, operating costs increased by £16 million or 2% year-on-year to £985 million.
Our ongoing operating cost base, which excludes one-offs and restructuring and integration costs, increased by £16 million year-on-year to £981 million. The majority of the year-on-year cost increase related to £29 million of inflationary costs and £4 million on employee incentive costs, which was partly offset by £17 million of restructuring and integration benefits, taking the total cost savings achieved in the last three years to £55 million. We continue to invest in the business, increasing our organic investment by £4 million in the year to £35 million, which was at the lower end of our guidance range.
We benefited from a £5 million one-off gain, largely driven by a £3 million profit on the disposal of sales activities in the Nordics and Baltics. Restructuring and integration costs were £9 million in the year.
Guidance points for 2026/27 – we expect inflation on our ongoing operating cost base to be 3%, variable costs to be 6% of revenue, continued build of employee incentive to be c. £5-£10 million and cost savings to be £10-15 million having absorbed further skills investment and incremental software as a service licence costs. Organic investments to be at the top-end of our target range £35-£45 million. Our restructuring and integration costs to deliver the savings to be c. £10 million.
Operating profit and margin
Operating profit of £239 million was up 2% compared to the prior period. Adjusted operating profit, saw a decrease of 3% (4% on a like-for-like basis). This reflects the regional movements described in the Regional Performance section, partially offset by the £3 million profit on disposal. Operating profit margin increased by 0.3 percentage points to 8.3% and on an adjusted basis declined by 0.2 percentage points to 9.2%, with volume pressure from softer markets and increased organic investment to a large extent mitigated by our cost benefits and gross margin improvement. As a result, adjusted operating profit conversion (adjusted operating profit / gross profit) declined by 1.1 percentage points on a like-for-like basis to 21%. Reported operating profit conversion improved by 0.4 percentage points to 19%.
Items excluded from adjusted profit
To improve the comparability of information between reporting periods, we exclude certain items from adjusted profit measures. The items excluded are described below (see Note 12 for more detail on definitions and reconciliations of adjusted measures).
Adjusted items include acquisition-related net gain of £9 million (2024/25: net cost of £4 million) which included an £11 million legal settlement income offset by transaction costs related to the BPX acquisition and other acquisition-related expenses, amortisation and impairment of acquired intangibles of £20 million (2024/25: £37 million), and a £15 million impairment charge on certain technology assets, reflecting components whose functionality has been superseded by recently implemented replacement systems
REGIONAL PERFORMANCE
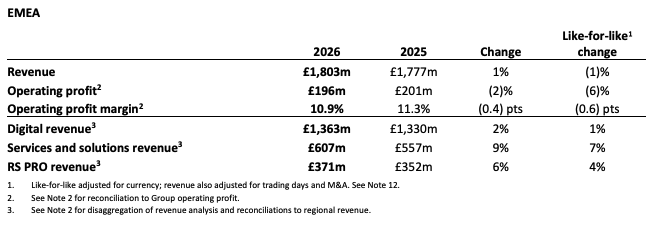
In EMEA, we have a broad product and services and solutions proposition and significant opportunity to grow market share, with an emphasis on serving larger Corporate and Key customers. We remain focused on delivering clear and omni-channel propositions to our customers and suppliers whilst driving efficiencies, reducing costs to serve and to benefit from improved operational leverage.
Revenue increased by 1% but was down 1% on a like-for-like basis, with a slightly stronger Euro during the period which was offset by fewer trading days. Reported revenue for the period included one month from the BPX acquisition. Despite weak markets, we saw revenue growth in our larger markets of UK and Ireland, France and Italy for the year, but a decline in the DACH region, where end-markets have been weaker. PMIs across the region were below the 50 level for most of the year, with the UK in expansion from November 2025 and the remaining markets from February this year.
Our strategic focus continues to be growing higher potential lifetime value customers, and as a result of some large Pan-EMEA contract wins with customers wanting to consolidate their supplier base, our like-for-like revenue from the corporate customer segment grew 6%. Revenue from Standard, web-focused customers who are more transactional, grew by 4%, whilst the number of customers declined as a result of the short-term disruption from the closure of Distrelec’s DC and discontinuation of non-profitable products. Our more resilient product categories of Facilities & Maintenance and Mechanical & Fluid Power delivered like-for-like growth for the year, which also contributed to the higher gross margin uplift in the second half of the year with our core Automation, Control & Electrification categories seeing recovery in the second half. Additionally, the data we gather from suppliers shows that we have gained market share overall in EMEA, particularly in Facilities & Maintenance and Cables & Connectors, with stronger competitive pressure in Automation, Control & Electrification and PPE categories.
UK and Ireland, which accounts for 38% of the region’s revenue returned to growth on a like-for-like basis for the year, accelerating from (1)% in the first half to 2% in the second half supported by strategic pricing initiatives. In Q4, we completed the acquisition of BPX which specialises in supporting industrial customers with technical automation and control solutions in UK and Ireland. As part of our UK & Ireland business, BPX will strengthen our technical capabilities within our core product categories and deepen our strategic supplier partnerships.
France, which accounts for 20% of the region’s revenue, continued to deliver robust growth throughout the year, with like-for-like revenue up 6% despite a weak and uncertain economic backdrop with PMI largely below 50 recovering in Q4. France is realising the benefit of a strategically targeted product and sales offer to serve more resilient industry verticals, particularly those connected to process manufacturing such as food and beverage.
DACH (Germany, Austria and Switzerland), which accounts for 14% of the region’s revenue, saw an 8% like-for-like revenue reduction, with a small improvement in the second half of the year. This performance was a result of continued weak end-markets with contracting PMIs as well as the anticipated operational disruption as part of the integration of Distrelec, particularly during the decommissioning of certain products as well as the closure of their distribution centre in the Netherlands in the first half of the year. The integration of Distrelec is largely complete, with the transition of the Swiss website and back-end systems being the last of the integration, and has delivered synergies well ahead of our business case.
RS Integrated Supply EMEA like-for-like revenue grew by 6%, as they leveraged their technology-led approach to business procurement outsourcing in attractive industry verticals with a strong pipeline of customer opportunities. The business is more profitable as a result of exiting unprofitable contracts and replacing them with contracts that better reflect the solutions we provide for customers that value our outsourced supply chain and procurement process services.
Digital revenue (76% EMEA revenue) returned to growth in the second half of the year and up 1% on a like-for-like basis for the year. This performance was as a result of strong growth in our eProcurement and Purchasing Manager platforms which is focused on larger, higher value customers, and creates longer lifetime customer value. This performance is included in like-for-like services and solutions revenue growth of 7%. This was partly offset by web revenue (61% of digital revenue) which was down year-on-year, reflecting reduced activity from more transactional customers, particularly in the DACH region as suggested above. RS PRO like-for-like revenue was up 4% and now contributes 21% of total EMEA revenue.
EMEA’s like-for-like gross margin was flat year-on-year with benefits from pricing discipline largely associated to inflationary increases. Benefits from the integration of Distrelec and strong cost control offset inflation in the cost base and a targeted increase in digital marketing to drive digital performance. This resulted in a £5 million decrease in reported operating profit to £196 million, and a resulting decline to operating profit margin to 10.9% year-on-year.
EMEA’s rolling 12-month Transactional NPS was 46.6, down from 48.5 in 2024/25. The decline reflects temporary disruption to product availability data during the upgrade to our new product availability and tracking system in the first half, which was resolved in the second half and as a result monthly NPS has recovered.
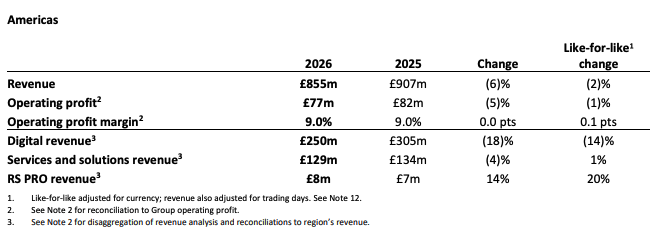
In Americas, we have a strong technical A&C and Electrification focus, with expanding presence and solutions expertise. We see the opportunity to broaden our high lifetime potential customer base, expand our offer and gain customer share of wallet through targeted supplier and customer propositions, enhanced digital capability and improved own-brand RS PRO range.
Americas like-for-like revenue decreased by 2% for the year. However, our US and Canada business (73% of the region’s revenue) grew by more than 2% on a like-for-like basis, accelerating in the second half. During the first half, we launched a new digital commerce platform in the US which had a short-term adverse impact on our digital revenue, however this was to a large extent offset by strong performance in offline sales as the result of focused activities with key suppliers, product category expansion, sales process improvements and some channel shift by existing customers from digital to offline transactions. Services and solutions in the US and Canada saw like-for-like revenue growth of 12% driven by increased demand for technical design solutions and expanded use of eProcurement by larger customers. The US and Canada business saw growth in energy and utility, facility and logistics, and discrete manufacturing vertical markets.
In Mexico we support customers in factory fit out of automotive and control panels, and therefore sales include a larger proportion of larger orders tied to capital investment. Economic and political uncertainty in Mexico, including ongoing concerns around tariffs and delays to a trade agreement with the US, led many large customers in the region to defer capital expenditure. This is reflected in Mexican Manufacturing PMIs, which fell below 50 in September and reached a low of 46 in December. Against this backdrop, like-for-like revenue in Latin America (c. 20% of regional revenue), declined by 13%. Mexico’s like-for-like revenue in the first half decreased by 6% with a weighting to Q2. However, the lack of trade agreement visibility continued through the second half with Mexico declining by 21% over the same period – half the decline relating to the strengthening of the Peso against the US dollar. We have visibility of strong pipelines and a backlog of customers positions and remain confident that, as tariff uncertainty reduces, activity levels will recover.
At a product category level, sales in US and Canada for Automation, Control and Electrification products (c. 68% of the revenue) grew at 3% on a like-for-like basis. Mechanical and Fluid Power, a key strategic growth lever, grew by around 8%, while Semis and Passives components returned to growth in the second half. RS PRO for the Americas like-for-like revenue increased by 20% driven by improved range and availability, increased sales and marketing focus to capture a greater share of customer spend in the US and Canada.
RS Integrated Supply Americas like-for-like revenue declined by 4%. However, profitability improved following the deliberate exit from unprofitable agreements, with the strategy refocused on leveraging our technology-led procurement outsourcing capabilities in attractive industry verticals and supported by a strong pipeline of new customer opportunities.
Americas gross margin increased 1.3 percentage points to 34.5%, mainly supported by c. 2 percentage point improvement in US & Canada reflecting strategic pricing initiatives, improved inventory management and changes to provisioning rates. Mexico’s gross margin was stable year-on-year, despite the revenue decline. Operating costs reflected inflationary pressures and continued strategic investments, however these were mitigated by disciplined cost management. Americas operating profit of £77 million was 5% lower than last year, and down 1% on a like-forlike basis, driven by strong growth in the US and Canada, but more than offset by Mexico. The resulting Americas operating margin was flat at 9.0%.
Americas rolling 12-month Transactional NPS was 56.8, down from 65.2 in 2024/25 initially impacted by the digital commerce launch, but monthly NPS recovered in the fourth quarter.
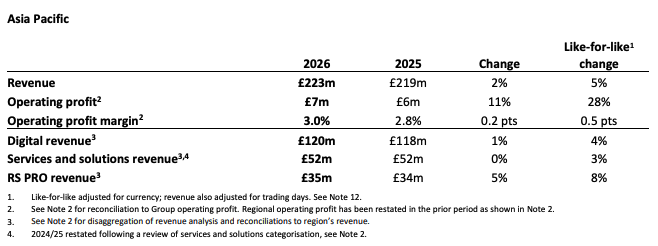
Asia Pacific benefits from the investment in process, inventory and infrastructure in our EMEA region, and is able to build positions in a number of markets with strong growth opportunities.
Asia Pacific revenue was up 5% on a like-for-like basis driven by both volume and pricing growth. Growth accelerated in the second half of the year and reflects both stable economic conditions, with PMIs remaining above 50 in most of our markets throughout the year and accelerated performance across our largest product categories, Automation & Control, Cables & Connectors and Facilities & Maintenance plus strong recovery of Semi and Passives. Strategic digital and marketing focus drove strong growth in Standard customers with like-for-like revenue up 23% and Corporate customers up 5%.
Australia and New Zealand (36% of the region’s revenue), delivered 8% like-for-like revenue growth, reflecting a resilient manufacturing environment throughout the year. Southeast Asia (33% of the region’s revenue), delivered 5% like-for-like revenue growth driven by the region’s strategy of driving growth in higher value corporate customers and increased take up of RS PRO products and eProcurement solutions. Greater China (representing 21% of the region’s revenue), saw a 2% increase in like-for-like revenue despite a weak first half with China and Taiwan growth accelerating in the second half. Hong Kong remains challenging due to significantly lower spend from a few large state-owned customers linked to government budgetary constraints. Japan and Korea, with 10% of the region’s revenue, delivered 3% like-for-like revenue growth, with particularly strong RS PRO growth.
Digital like-for-like revenue was up 4% year-on-year and contributes to 54% of Asia Pacific revenue. Performance was driven by both web growth and greater take up of our eProcurement solution by larger corporate customers. RS PRO like-for-like revenue was up 8%, accelerating in the second half, as we continue to enhance our go-to-market strategy, including targeted product marketing campaigns and focused product range catalogues.
Gross margin improved again in 2025/26 by 0.2 percentage points on a like-for-like basis, benefiting from favourable pricing and volume throughout the year. Regional operating costs increased by 4% on a like-for-like basis, driven by investment in our people, as well as increased freight costs. Increased operating costs were more than offset by our revenue growth, and as a result, operating profit increased by 11%, and 28% on a like-for-like basis, with a resulting operating margin of 3%.
Asia Pacific’s rolling 12-month Transactional NPS decreased in 2025/26 by 1.7 points to 17.3 as a result of a temporary impact on order fulfilment during implementation of our product availability and tracking system. This was resolved in the second half with a strong recovery in monthly NPS
GROUP FINANCIAL REVIEW CONTINUED
Net finance costs
Net finance costs decreased to £20 million (2024/25: £27 million), reflecting reduction in net debt and lower market interest rates. At 31 March 2026, 34% of gross borrowings (excluding lease liabilities) were at fixed rates, unchanged year-on-year, with surplus cash held at variable rates
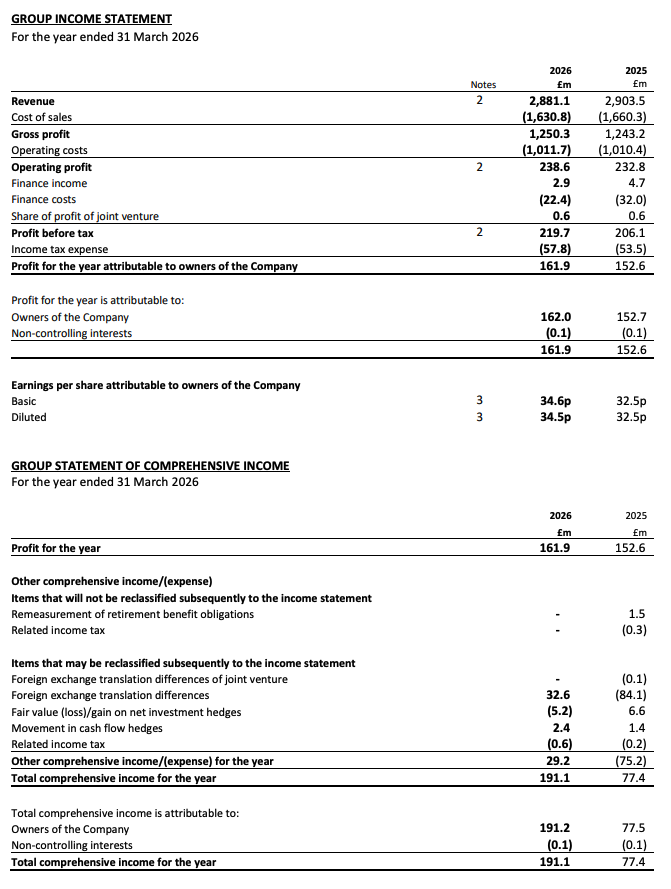
Profit before tax
Profit before tax increased by 7% to £220 million. Adjusted profit before tax declined by 1% to £246 million, or 2% lower on a like-for-like basis.
Taxation
The income tax charge was £58 million (2024/25: £54 million). The adjusted tax charge was £65 million (2024/25: £64 million), resulting in an effective tax rate of 26.4% (2024/25: 25.8%) driven by overseas tax rate differentials, non-deductible items, movements in uncertain tax positions and prior year adjustments. Going forward, we expect the full-year 2026/27 effective tax rate on adjusted profit before tax to be c. 27.0%.
Earnings per share
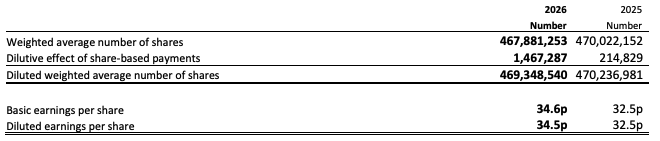
Earnings per share rose by 6% to 34.6p (2024/25: 32.5p). Adjusted basic EPS was 38.7p, 1% lower year-on-year and 2% lower on a like-for-like basis.
EBITDA
EBITDA was broadly stable at £319 million, reflecting operating profit performance and slightly lower depreciation and amortisation.
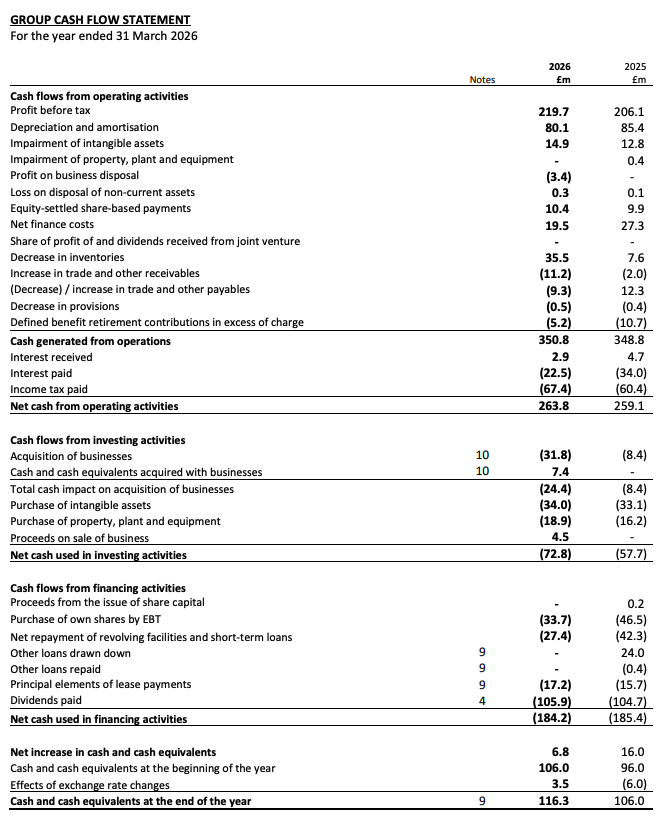
Cash flow and working capital
Cash generated from operations was £351 million (2024/25: £349 million), delivering adjusted operating cash conversion of 109%, well above the >80% target. Adjusted free cash flow was £202 million (2024/25: £214 million), with year-on-year decline primarily reflecting lower adjusted EBITDA and increased capital expenditure, partially offset by active management of working capital. After accounting for the cash effect of adjusting items (including the net gain related to the acquisition-related legal settlement) free cash flow increased by £1 million.
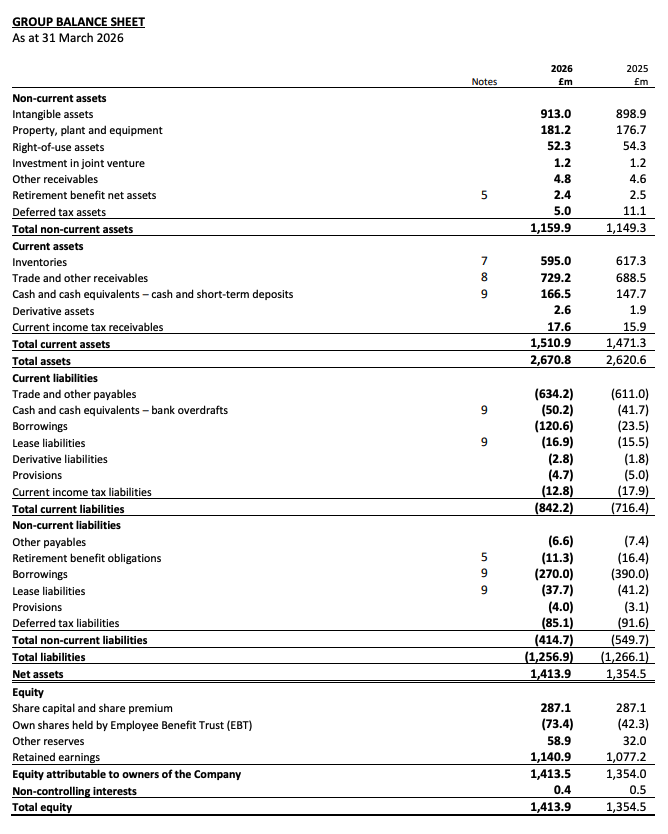
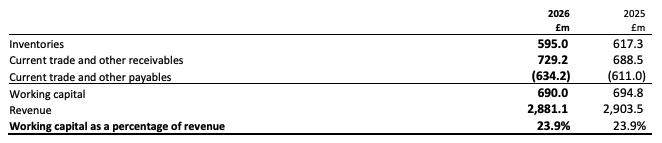
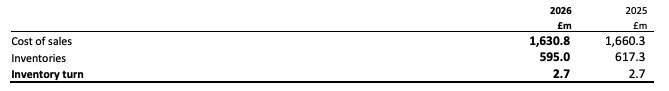
Working capital reduced as revenues declined and we took an active working capital management position, with working capital remaining stable at 24% of revenue. Trade and other receivables increased by £41 million to £729 million, driven by higher Q4 sales and balances acquired with BPX. Credit risk continues to be tightly managed. Inventories decreased by £22 million to £595 million, with provision rates improving to 11.9% (2024/25: 12.3%). Inventory turns remained stable at 2.7x. Trade and other payables rose by £23 million to £634 million, primarily reflecting the acquisition of BPX and higher March trading.
Looking forward, we continue to manage our working capital position actively and optimising cash conversion is a key area of focus. We remain focused on receivables collection. We will continue to seek to manage our inventory levels to take account of changing demand dynamics and supply chain behaviour, whilst anticipating our customers’ expectations. We will continue to invest in the right inventory to ensure that we remain well positioned to maintain service levels and deliver strong growth as markets recover. We pay our suppliers to terms and continue to work with some of our larger suppliers to improve terms where possible.
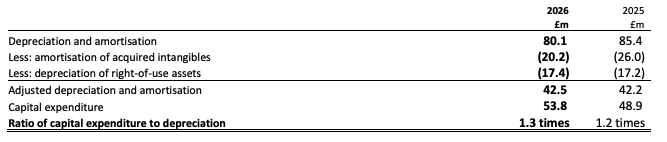
Net capital expenditure increased to £53 million (2024/25: £49 million), reflecting continued investment in supply chain (e.g. our DC in Italy) and customer experience capabilities (e.g. Digital commerce). Capex represented 1.3x depreciation, within the normal range. 2026/27 capex is expected to remain around £50 million.
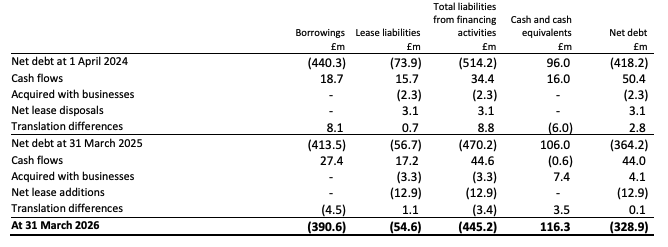
Net debt and liquidity
Net debt reduced to £329 million (2024/25: £364 million), reflecting strong free cash flow, partially offset by dividends (£106 million), purchase of shares in relation to employee share schemes (£34 million), and the BPX acquisition (£28 million).
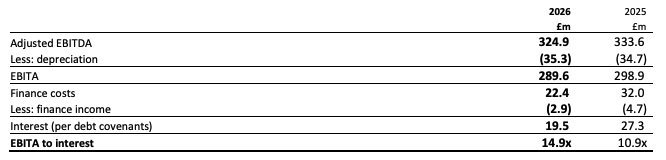
Committed facilities total £682 million, with £335 million undrawn at year end. Financial headroom remains strong, with net debt to adjusted EBITDA at 1.0x and EBITA to interest of 14.9x, well within covenant limits.
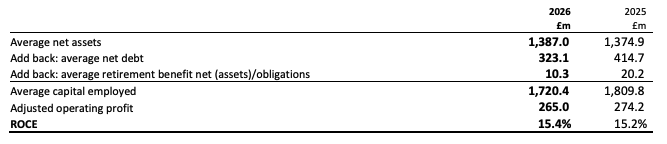
Return on Capital Employed
ROCE increased to 15.4% (2024/25: 15.2%), driven by lower capital employed, partially offset by lower adjusted operating profit.
Retirement benefit obligations
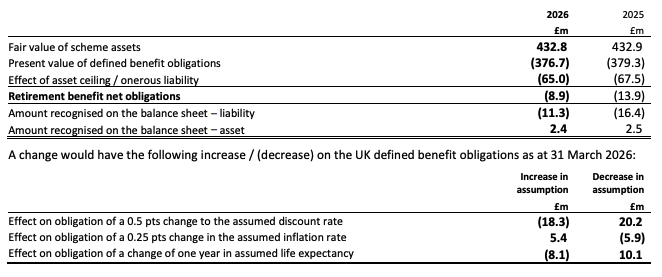
The UK pension recovery plan has been completed. Preliminary results from the 31 March 2025 triennial valuation indicate a likely surplus. No contributions are expected to the UK scheme in 2026/27, with £0.4 million payable to other defined benefit schemes.
Dividend and capital allocation
In line with our capital allocation policy and disciplined approach to deploying capital across both organic and M&A opportunities, the Board has reviewed the strength and efficiency of the balance sheet and intends to continue to pursue a progressive dividend policy, alongside the return of £100 million of capital to shareholders via a share buyback.
A progressive dividend policy supports the Group’s commitment to maintaining healthy dividend cover over time, underpinned by improving performance and strong cash generation. The share buyback will be conducted over a 12- month period, and the Board will continue to review efficient deployment of capital in line with the capital allocation policy
The Board proposes a final dividend at 14.2p per share. This will be paid on 24 July 2026 to shareholders on the register on 12 June 2026. As a result, the total proposed dividend for 2025/26 will be 22.9p per share, representing an increase of 2% over the 2024/25 full-year dividend. Adjusted earnings dividend cover for 2025/26 is 1.7 times.
Foreign exchange
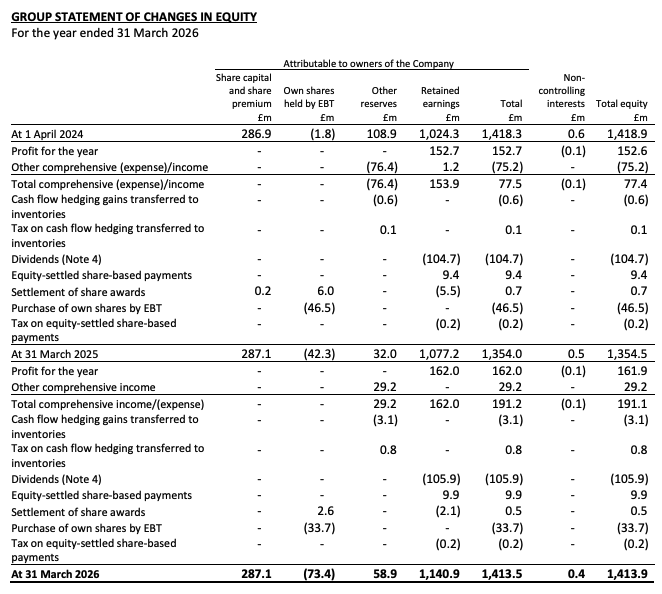
The Group does not hedge translation exposure on the income statements of overseas subsidiaries. Based on the mix of non-sterling denominated revenue and adjusted operating profit, a one cent movement in the Euro and US dollar would impact annual adjusted profit before tax by £1.8 million and £0.5 million respectively. Translation gains of £33 million were recorded in Other Comprehensive Income, partially offset by £5 million of net investment hedge losses. The Group is also exposed to foreign currency transactional risk because most operating companies have some level of payables or receivables in currencies other than their functional currency. Where the exposure is material, Group Treasury maintains three to seven months hedging against freely tradable currencies to smooth the impact of fluctuations in currency. The Group’s largest exposures relate to euros and US dollars.
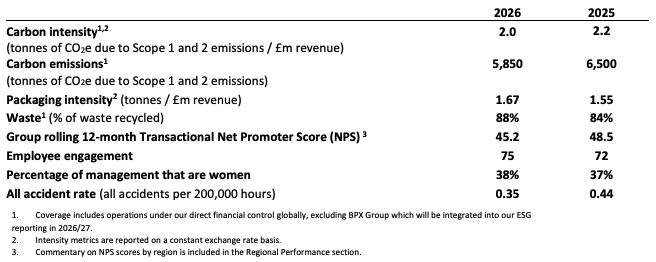
Non-Financial Key Performance Indicators (KPIs)
We have eight non-financial KPIs to help measure progress against our strategy and the commitments of our 2030 ESG action plan – For a Better World. To provide greater transparency on our performance in the period, a summary of our progress is included below with further details available in the ESG section on our website: www.rsgroup.com/sustainability.
RISKS AND UNCERTAINTIES
The Board has overall accountability for the Group’s risk management, which is delegated to the Executive Committee and supported by the Group’s risk team. The Board is fully committed to setting and embedding a sound risk culture which is aligned with the principles and ethics of the Group.
The Group has a defined risk appetite, approved by the Board, which reflects the Group’s willingness and ability to absorb the impact of risk and the Board’s appetite for such risks in six risk categories: strategy and change, operational, regulatory compliance, financial resilience, customer experience, and product risks. The business uses consistent impact and likelihood assessment criteria with behaviours that are mapped across the six categories of risk and are aligned to the strategy of the business and the products and services that RS Group provides.
For further information on the Group’s approach to risk management see the “Risks, viability and going concern” section of the 2026 Annual Report and Accounts.
Principal risks and uncertainties
The principal risks disclosed in the 2026 Annual Report and Accounts are:
- 1. Cyber and information security
- 2. Legal and regulatory compliance
- 3. Geopolitical and macroeconomic environment
- 4. Change initiatives
- 5. Talent and capability
- 6. Market disruption
- 7. Business resilience
- 8. Climate change
- 9. M&A activity
FORWARD-LOOKING STATEMENTS
This financial report contains certain statements, statistics and projections that are or may be forward-looking. The accuracy and completeness of all such statements, including, without limitation, statements regarding the future financial position, strategy, projected costs, plans and objectives for the management of future operations of RS Group plc and its subsidiaries is not warranted or guaranteed. These statements typically contain words such as “may”, “will”, “should”, “project”, “intends”, “expects”, “anticipates”, “estimates” and words of similar import are forward looking statements. By their nature, forward-looking statements involve risk and uncertainty because they relate to events and depend on circumstances that will occur in the future. Although RS Group plc believes that the expectations reflected in such statements are reasonable, no assurance can be given that such expectations will prove to be correct. There are a number of factors, which may be beyond the control of RS Group plc, which could cause actual results and developments to differ materially from those expressed or implied by such forward-looking statements. Other than as required by applicable law or the applicable rules of any exchange on which our securities may be listed, RS Group plc has no intention or obligation to update forward-looking statements contained herein.
NOTES TO THE PRELIMINARY ACCOUNTS
1. Basis of preparation
The financial information contained in this release does not constitute the Company’s statutory accounts for the years ended 31 March 2026 or 31 March 2025 but is derived from those accounts. The accounts are prepared in accordance with UK-adopted international accounting standards (UK IAS) and the requirements of the Companies Act 2006. None of the new accounting standards, amendments or revisions to existing standards or interpretations which have become effective have had a material impact on the reported results or financial position of the Group. Statutory accounts for the year ended 31 March 2025 have been delivered to the Registrar of Companies and those for the year ended 31 March 2026 will be delivered following the Company’s Annual General Meeting. The auditors have reported on both of these sets of accounts. Their reports were unqualified, did not include a reference to any matters to which the auditors drew attention by way of emphasis without qualifying their report and did not contain any statement under sections 498(2) or 498(3) of the Companies Act 2006. The accounts for the year ended 31 March 2026 were approved by the Board of Directors on 19 May 2026.
The accounts have been prepared on a going concern basis. In adopting the going concern basis for preparing the accounts, the Board has considered the Group’s future trading prospects; the Group’s available liquidity, the maturity of its debt facilities and obligations under its debt covenants; and the Group’s principal risks.
Reverse stress tests have been undertaken on the latest forecast to assess the circumstances that would threaten the Group’s current financing arrangements. These included significant declines in revenue, significant declines in revenue and gross margin, and a major deterioration in cash collection. These reverse stress tests assumed that capital expenditure and operating costs are unchanged from those in the forecast, no significant working capital initiatives occur in mitigation, dividends continue to be paid and there are no changes in or extensions to debt financing.
Based on the assessment outlined above and the output of detailed rolling forecasts, the Board believes that it is appropriate to continue to adopt the going concern basis in preparing the Group’s accounts.
2. Segmental reporting
The Group’s operating segments comprise three geographical regions: EMEA, Americas and Asia Pacific.
The Group’s largest own brand is RS PRO. Services and solutions includes procurement solutions, maintenance solutions and other solutions. In the tables below, revenue is disaggregated by sales channels, RS PRO or other and Services and solutions or other. £2,791.0 million of revenue is recognised at a point in time (2024/25: £2,805.2 million) and £90.1 million over time (2024/25: £98.3 million).
Sales channels, brands and services and solutions
During the year the Group reviewed its categorisation of services and solutions revenue in Asia Pacific and identified that certain revenues should have been categorised differently, resulting in an increase in services and solutions revenue of £4.9 million in the year ended 31 March 2025. The information below represents the new classifications.
3. Earnings per share
4. Dividends
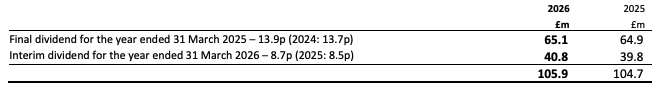
The trustees of the EBT have waived their right to receive dividends and this amounts to £1.5 million (2024/25: £0.8 million).
A proposed final dividend for the year ended 31 March 2026 of 14.2p is subject to approval by shareholders at the Annual General Meeting on 16 July 2026 and the estimated amount to be paid of £65.8 million has not been included as a liability in these accounts. This will be paid on 24 July 2026 to shareholders on the register on 12 June 2026 with an ex-dividend date of 11 June 2026.
5. Retirement benefit obligations
The Group operates defined benefit schemes in the United Kingdom and Europe.
6. Intangible assets
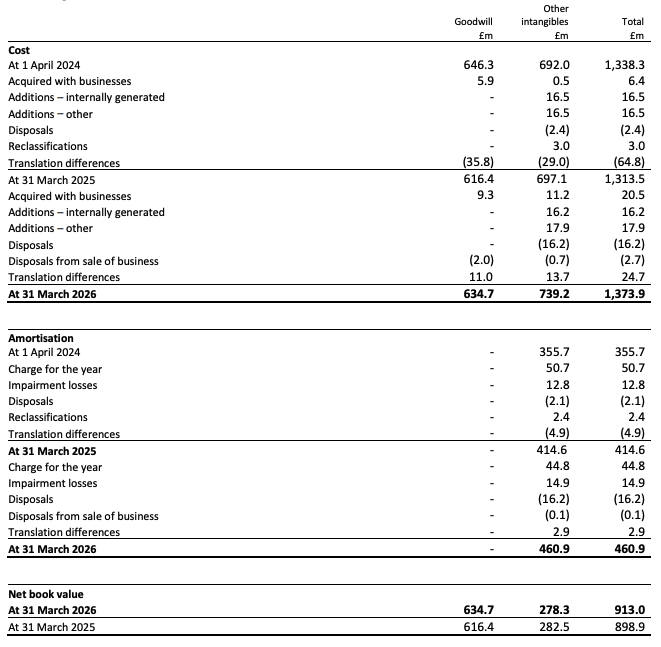
In the year ended 31 March 2026, the Group undertook a review of its assets and recognised an impairment charge of £14.9 million on certain technology assets including the production management system and inventory availability and production fulfilment module, for which functionality was superseded by the release of new assets. These assets were assessed as providing no future economic benefits and these components were fully written down. In the previous year, the impairment assessment of the customer contracts, relationships and distribution agreements indicated that the asset related to the acquisition of RS Integrated Supply EMEA required full impairment, with an impairment charge of £10.9 million recorded in the year ended 31 March 2025. In addition, £0.4 million of software acquired with RS Integrated Supply EMEA was also impaired.
7. Inventories
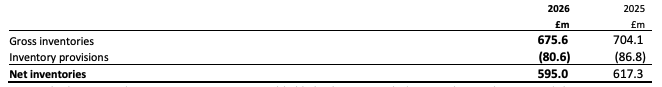
Currently the Group does not expect any reasonably likely changes, including regulatory changes and the current global economic and geopolitical uncertainties, to have a material impact on the net realisable value of inventories.
8. Trade and other receivables
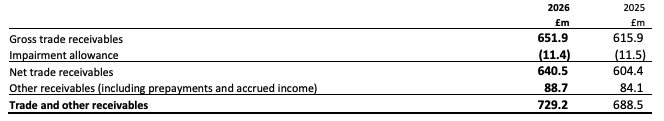
Trade receivables are written off when there is no reasonable expectation of recovery, for example when a customer enters liquidation or the Group agrees with the customer to write off an outstanding invoice.
9. Net debt
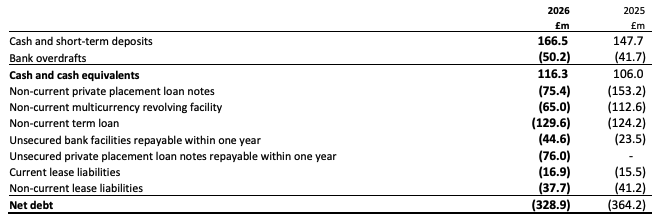
The £400 million multicurrency revolving facility has a maturity of October 2029 and the €150 million term loan has a maturity of October 2028.
Movements in net debt were:
10. Acquisitions
On 1 March 2026 the Group acquired 100% of the issued share capital of BPX Group Holdings Limited, a UK and Ireland based specialist distributor of industrial automation and control products. BPX stocks, supports and supplies automation and control components, devices and solutions from many of the world’s leading electrical, electronic and pneumatic manufacturers. Serving over 6,000 active customers, BPX’s offering is highly complementary to the Group’s automation and control capabilities, and further expand the Group’s relationship with key suppliers. The goodwill arising on the acquisition represents the anticipated revenue synergies through offering enhanced product and capability to complementary customers in addition to the optimisation of combined costs over the medium term.
The fair value of the net assets acquired, consideration paid and goodwill arising, plus transaction costs and contribution to the Group’s results since acquisition were:
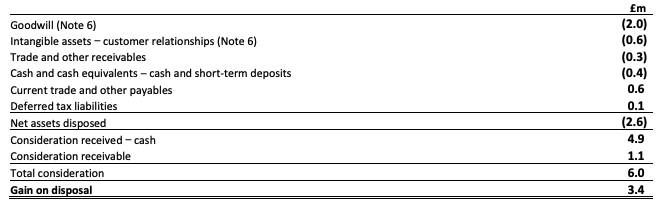
11. Disposal
On 1 August 2025 the Group disposed of its sales activities in Finland, Estonia, Lithuania and Latvia to Boreo plc, the Group’s exclusive regional distributor in those regions. RS will continue to supply Distrelec customers in these markets through an expanded distribution agreement. These activities were acquired on 30 June 2023 as part of the acquisition of Distrelec B.V. and its subsidiaries (Distrelec), a high-service, digital-led distributor of industrial and maintenance, repair and operations (MRO) product in Europe, and were included in EMEA. The transaction was in the form of both a transfer of share capital (Finland) and of assets and trade, with compensation received for any working capital liabilities (Estonia, Lithuania and Latvia). The disposal includes the transfer of customer relationships and staff, excluding the shared service centre activities in Latvia which is retained by the Group. The gain on disposal is recognised in the income statement within operating profit.
The carrying value of the net assets disposed, consideration received and resulting gain on disposal were:
12. Alternative Performance Measures (APMs)
The Group uses a number of APMs in addition to those measures reported in accordance with UK IAS. Such APMs are not defined terms under UK IAS and are not intended to be a substitute for any UK IAS measure. The Directors believe that the APMs are important when assessing the financial and operating performance of the Group. The APMs are used internally for performance analysis and in employee incentive arrangements, as well as in discussions with the investment analyst community.
The APMs assist with the comparability of information between reporting periods by adjusting for factors such as fluctuations in foreign exchange rates, number of trading days and items, such as reorganisation costs, that are substantial in scope and impact and do not form part of operational or management activities that the Directors would consider when assessing performance. The Directors review on at least an annual basis the threshold for what is substantial, in the context of the business performance. The Directors also believe that excluding recent acquisitions, amortisation and impairment of acquired intangibles and acquisition-related items aids comparison of the performance between reporting periods and between businesses with similar assets that were internally generated.
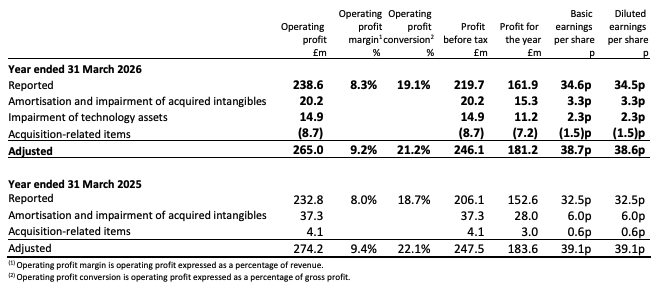
Adjusted profit measures
These are the equivalent UK IAS measures adjusted to exclude amortisation and impairment of intangible assets arising on acquisition of businesses, acquisition-related items, substantial reorganisation costs, substantial asset write-downs, one-off pension credits or costs, significant tax rate changes and, where relevant, associated income tax effects. Adjusted operating profit conversion, adjusted operating profit margin and adjusted earnings per share are financial key performance indicators (KPIs) which are used to measure the Group’s progress in delivering the successful implementation of its strategy and monitor and drive its performance.
In the year ended, 31 March 2026, the Group undertook a review of its assets and recognised an impairment charge of £14.9 million on certain technology assets, for which functionality was superseded by the release of new assets. In the year ended 31 March 2025, the customer contracts, relationships and distribution agreements in relation to the acquisition of RS Integrated Supply EMEA were fully impaired, with an impairment charge of £10.9 million. In addition, £0.4 million of software acquired with RS Integrated Supply EMEA was also impaired.
Acquisition-related items comprise transaction costs directly attributable to the acquisition of businesses, any deferred consideration payments relating to the retention of former owners and key employees of acquired businesses expensed as remuneration, adjustments to acquisition-related indemnification assets and the related liabilities that result from events after the acquisition date and any remeasurements of contingent consideration payable on acquisition of businesses that result from events after the acquisition date.
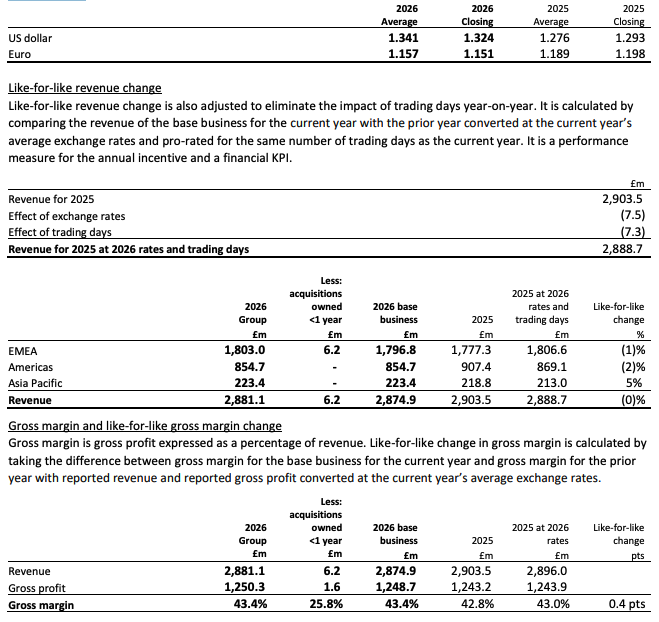
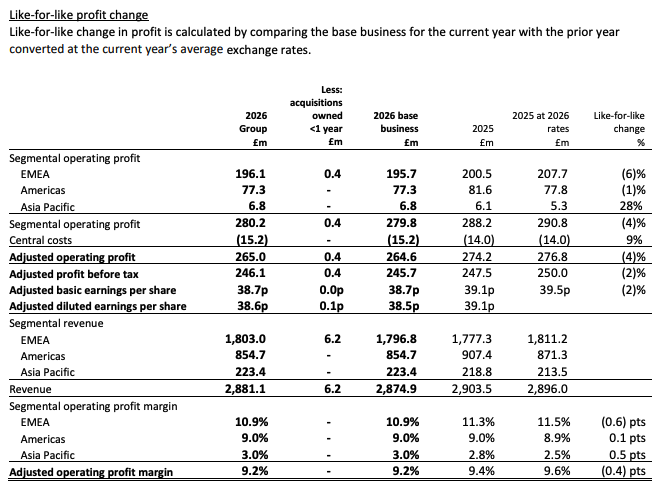
Like-for-like revenue and profit measures
Like-for-like revenue and profit measures are adjusted to exclude the effects of changes in exchange rates on translation of overseas profits. They exclude acquisitions in the relevant years until they have been owned for a year, at which point they start to be included in both the current and comparative years for the same number of months. These measures enable management and investors to track more easily, and consistently, the performance of the business.
The principal exchange rates applied in preparing the Group accounts and in calculating the following like-for-like measures are:
Adjusted free cash flow and adjusted operating cash flow conversion
Adjusted free cash flow is net cash from operating activities less purchases of intangible assets, property, plant and equipment plus any proceeds on sale of intangible assets, property, plant and equipment, adjusted for the cash impact of substantial reorganisation and acquisition-related items.
Adjusted operating cash flow is adjusted free cash flow before income tax and net interest paid. Adjusted operating cash flow conversion is adjusted operating cash flow expressed as a percentage of adjusted operating profit and is a financial KPI.
Earnings before interest, tax, depreciation and amortisation (EBITDA), net debt and net debt to adjusted EBITDA
EBITDA is operating profit excluding depreciation and amortisation. Net debt to adjusted EBITDA (one of the Group’s debt covenants) is the ratio of net debt to EBITDA excluding impairment of intangible assets arising on acquisition of businesses, acquisition-related items, substantial reorganisation costs, substantial asset write-downs and one-off pension credits or costs on an annualised basis covering the preceding twelve-month period. Net debt comprises cash and cash equivalents, borrowings and lease liabilities and is reconciled in Note 9.
Earnings before interest, tax and amortisation (EBITA) and EBITA to interest
EBITA is adjusted EBITDA after depreciation. EBITA to interest (one of the Group’s debt covenants) is the ratio of EBITA to finance costs including capitalised interest less finance income (interest per debt covenants).
Return on capital employed (ROCE)
ROCE is annualised adjusted operating profit expressed as a percentage of annualised monthly average net assets excluding net cash / debt and retirement benefit obligations and is an underpin for the LTIP Award and a financial KPI. Annualised monthly average net assets, annualised average net debt and annualised average retirement benefit net (assets) / obligations are the average of those respective month-end balances of the preceding thirteen months.
Working capital as a percentage of revenue
Working capital is inventories, current trade and other receivables and current trade and other payables.
Inventory turn
Inventory turn is cost of sales divided by inventories.
Ratio of capital expenditure to depreciation
Ratio of capital expenditure to depreciation is capital expenditure divided by depreciation and amortisation excluding amortisation of acquired intangibles and depreciation of right-of-use assets.
SourceRS Group
EMR Analysis
More information on RS Group plc: See the full profile on EMR Executive Services
More information on Baroness Rona Fairhead (Chairman, RS Group plc): See the full profile on EMR Executive Services
More information on Simon Pryce (Chief Executive Officer, RS Group plc): See the full profile on EMR Executive Services
More information on Kate Ringrose (Chief Financial Officer, RS Group plc): See the full profile on EMR Executive Services
More information on BPX Group by RS Group plc: https://www.bpx.co.uk/page/bpx-group + Eight complementary businesses with one shared aim to deliver excellence in the field of industry.
If you’re searching for industry 5, if your IT meets your OT, or if your challenge is IOT, the BPX Group has a unique combination of business to business solutions and propositions that work neatly together to form a complete offer, whatever your industry. Our specialisation is Industrial Automation and Control and our offer is offline, online and always on hand. We are built from origins in bricks and mortar but today the BPX Group is both digital and physical.
We are BPX, c. 230 amazing, caring and knowledgeable people, based in 20 branches throughout the UK and Ireland and supplying customers worldwide with automation and control products.
For over 60 years, we have been proudly stocking, selling, supporting, and servicing automation and control components, devices, and solutions, operating as distributors for many of the world’s leading electrical, electronic, and pneumatic manufacturers, including Schneider Electric, Phoenix Contact, Weidmuller, Omron, and Mitsubishi Electric.
More information on Guy Collins (Director, BPX Group, RS Group plc): See the full profile on EMR Executive Services
More information on RS PRO by RS Group plc: See the full profile on EMR Executive Services
More information on Distrelec B.V. by RS Group plc: See the full profile on EMR Executive Services
More information on Holger Ruban (Chief Executive Officer, Distrelec, RS Group plc): See the full profile on EMR Executive Services
EMR Additional Financial Notes:
- Major financial KPI’s since 2017 are available on EMR Executive Services under “Financial Results” and comparison with peers under “Market Positioning”
- Companies’ full profile on EMR Executive Services are based on their official press releases, quarterly financial reports, annual reports and other official documents.
- All members of the Executive Committee and of the Board have their full profile on EMR Executive Services
- The RS Group plc Full Year Financial Statements 2026 can be found here: https://www.rsgroup.com/media/oyxhkuz1/rs-group-2025-26-results.pdf
- The RS Group plc Full Year Financial Presentation 2026 can be found here: https://www.rsgroup.com/media/driou1ix/rs-group-2025-26-results-presentation.pdf
- The RS Group plc Annual Report 2025 can be found here: https://www.rsgroup.com/media/ovnhuoll/rs-group-annual-report-2025.pdf
- The RS Group plc Strategic Report 2025 can be found here: https://www.rsgroup.com/media/qnclwunt/rs_group_2025_strategic_report.pdf
- The RS Group plc ESG Report 2025 can be found here: https://www.rsgroup.com/media/l2rdaacx/rs_group_2025_esg_report.pdf
- The RS Group plc Governance Report 2025 can be found here: https://www.rsgroup.com/media/3znaqmxo/rs_group_2025_governance_report.pdf
- The RS Group plc Financial Statements 2025 can be found here: https://www.rsgroup.com/media/fginugqa/rs_group_2025_financial_statements.pdf
- The RS Group plc full-year 2025 statement can be found here: https://www.rsgroup.com/media/nyanw0xt/fy25-rns-final.pdf
- The RS Group plc full-year 2025 Presentation can be found here: https://www.rsgroup.com/media/a1ubhzg3/rs-full-year-2024-25-presentation.pdf
- The RS Group plc Annual Report 2024 can be found here: https://www.rsgroup.com/media/vsafnkjd/rs-group-2024-annual-report.pdf
- The RS Group plc Full-Year Results 2023/24 can be found here: https://www.rsgroup.com/media/fhvpvy5k/rs-group-fy24-prelims-rns-220524.pdf
- The RS Group plc Annual Report 2023 can be found here: https://www.rsgroup.com/media/djxlphcv/rs-group-2023-annual-report-interactive.pdf
- The RS Group plc Full-Year Results 2022/23 presentation can be found here: https://www.rsgroup.com/sites/rsgroup/files/2023-05/2022-23-fy-results-presentation.pdf
- The RS Group plc Full-Year results 2022 presentation can be found here: https://www.rsgroup.com/sites/rsgroup/files/2022-24/fy22-full-year-presentation.pdf
- The RS Group plc Annual Report 2022 can be found here: https://www.rsgroup.com/sites/rsgroup/files/2022-06/2022%20ARA/RS_GROUP_AR_2022_Spreads.pdf