ABB – Q1 2026 results

Strong orders, business driven performance improvement and high cash flow
Ad hoc Announcement pursuant to Art. 53 Listing Rules of SIX Swiss Exchange
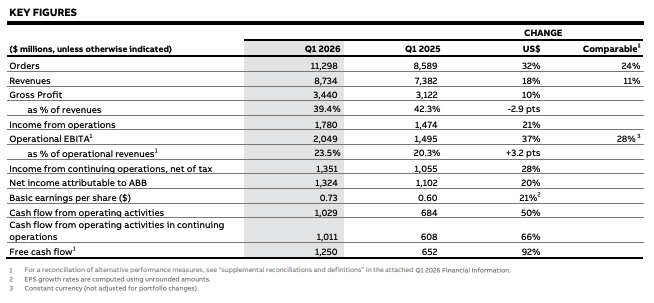
- Orders $11,298 million, +32%; comparable1 +24%
- Revenues $8,734 million, +18%; comparable1 +11%
- Income from operations $1,780 million; margin 20.4%
- Operational EBITA1 $2,049 million; margin1 23.5%
- Basic EPS $0.73; +21%2
- Cash flow from operating activities $1,029 million; +50%
- Return on Capital Employed1 27.2%
“ABB had a strong start to the year, delivering higher business performance and record orders. Supported by our high order backlog and good execution in a strong short-cycle market, we raise our growth and margin expectations for 2026, although acknowledging risks from geopolitical uncertainties.”
Morten Wierod, CEO
CEO summary
We have had a strong start to the year with a supportive overall market environment and improved business performance. Orders were at a record-high level and increased 24% on a comparable basis, supported by all three business areas. Overall demand remained robust throughout the period.
All in all, the first quarter progressed largely according to plan, despite a backdrop of yet another escalation in geopolitical tension. Our priority has been to support our employees directly impacted by the recent developments in the Middle East. Admittedly, this conflict adds uncertainty to the global trading climate, although to date, demand for our electrification and automation offerings has remained overall resilient and supportive to our raised ambitions for 2026.
We executed well on revenue growth which at 18% (11% comparable) was just above our original expectation and converted to a 37% (28% in local currencies) improvement in Operational EBITA and a margin of 23.5%. The margin improved by 320 basis points, out of which 250 basis points were attributable to the net impact of the gains on sale of real estate, and a robust 70 basis points was driven mainly by improved business performance. As a net total for the quarter, earnings per share increased by 21%.
Free cash flow of $1.3 billion is the strongest ever for a first quarter, with good contribution from both the earnings increase as well as net working capital management. Another stand-out number was our ROCE of 27.2%.
It was also good to receive the CDP sustainability recognition of A scores for both climate change and water stewardship. Our 2025 sustainability report was published in February, showing progress towards our 2030 targets.
We achieved book-to-bill of 1.29 with strong comparable order growth of 9% and 5% respectively in the Motion and Automation business areas, while Electrification surged 44%. Market momentum remains strongest in the data center segment, but also positive for grid investments. Other strong areas include electrical upgrades of land-based transport infrastructure, marine, port automation, HVAC and buildings. Similar to previous quarters, customer activity is more muted in parts of the process industry-related areas.
I was also pleased to see the Automation business area introduce the Automation Extended program, a strategic evolution of its distributed control systems (DCS). It is a step towards the next era of industrial operations. It enables customers to progressively introduce new capabilities, including advanced analytics and AI, while preserving system integrity. It securely and without operational disruption bridges the core control and the digital environment, supported by a unified lifecycle service for management and maintenance. ABB has the world’s largest DCS installed base and Automation Extended increases our presence in the digital environment.
Our capital allocation principles prioritize organic investments in our ability to serve customers through our local-for-local footprint. In recent years, India has grown to our tied for fourth largest market and this year we will invest approximately $75 million to expand our manufacturing footprint and R&D capabilities in all business areas. Our expanded facilities will support growth prospects in India as well as enhance our capabilities to serve other markets in the region.
Also on the topic of capital allocation – our balance sheet is strong and we strive to deploy more cash towards acquisitions. However, we will not compromise on value creation – every deal should deliver sustainable value and make strategic sense. In March, we rewarded our shareholders with a dividend distribution of CHF 0.94 per share, the equivalent of approximately 1.3% yield based on the recent share price. Additionally, in early February, we launched our previously announced share buyback program of up to $2.0 billion, corresponding to approximately 1.2% of recent market capitalization.
Outlook
based on current market environment
In the second quarter of 2026, we expect a high single-digit to low double-digit growth in comparable revenues, year-on-year. The operational EBITA margin should improve year-on-year.
In full-year 2026, we expect a positive book-to-bill, and a high single-digit to low double-digit growth in comparable revenues, year-on-year. The operational EBITA margin should improve year-on-year, even when excluding the real estate gain in the first quarter of 2026.
Orders and revenues
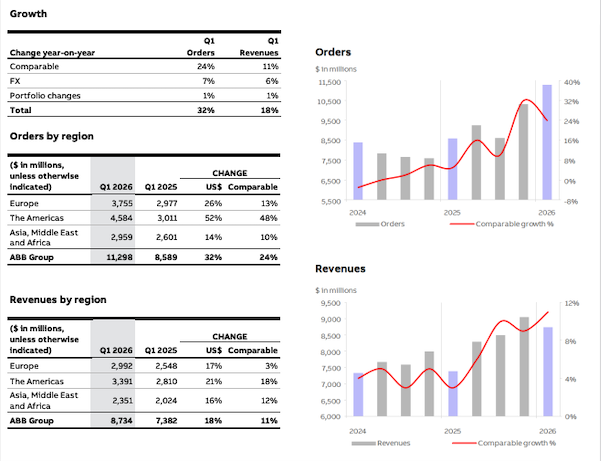
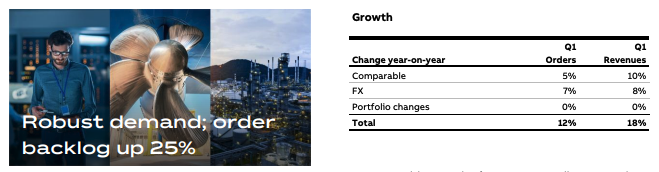
Market dynamics were strong and order intake was up by 32% (24% comparable) reaching a new all-time-high of $11,298 million. The increase from last year was primarily driven by comparable growth, with an additional 7% from favorable changes in exchange rates and 1% from portfolio changes. Book-to-bill was 1.29 and was positive in all business areas.
Overall for ABB, demand was robust throughout the period with no material impact from the Middle East conflict. Only in the business area Automation, some regional market disruption was noted at the end of the quarter.
Demand was positive across the majority of our main customer segments, resulting in strong order increase in all three business areas. In total, double-digit growth in the short-cycle businesses was further supported by higher large order bookings. Electrification recorded surging growth of 51% (44% comparable), Motion was up by 18% (9% comparable) and Automation improved by 12% (5% comparable). The order backlog reached the new record high of $27,515 million, up by 27% (22% comparable), year-on-year.
All regions improved orders at a double-digit rate. Americas was up by 52% (48% comparable), led by United States up 70% (67% comparable). Europe increased by 26% (13% comparable) with stable to positive developments in the topfive countries. Asia, Middle East and Africa was up 14% (10% comparable) including an increase of 9% (3% comparable) in China.
Transport-linked demand continued to be strong in the marine and ports segments. Rail is generally robust, although quarterly orders declined. Demand for land-based infrastructure benefited from upgrades of electrical equipment in airports, tunnels etc.
In the industrial space, a good development in utilities was clearly outpaced by a buoyant data center market.
The buildings segment improved, supported by increases in the US and Europe for both commercial and residential areas. China orders increased in a market which remains generally challenging.
Orders in the machine builder segment increased sharply in a still cautious market.
Sentiment in the oil & gas segment remained overall solid, although orders declined in the quarter. There was increased activity among nuclear customers. Mining orders increased slightly in a generally capex-muted market environment.
Revenues amounted to $8,734 million, up 18% (11% comparable) year-on-year. Despite the backdrop of high geopolitical tension, there was no real slowdown in customers’ willingness to receive deliveries. In contrast, short-cycle business remained strong and the order backlog was executed largely as planned. Strong comparable growth was driven by higher volumes, with added support from a positive price of approximately 1%. Favorable changes in exchange rates contributed 6% to total growth.
Earnings
Gross profit
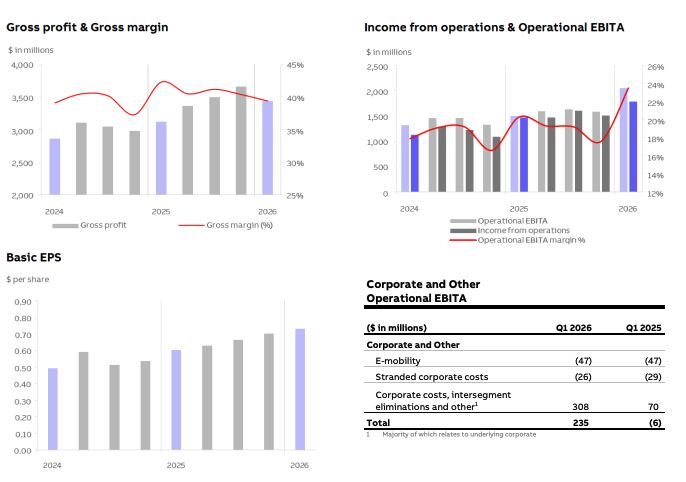
Gross profit increased by 10% (3% constant currency) year-on-year to $3,440 million, reflecting a gross margin of 39.4%, down 290 basis points. The gross margin decline was primarily due to the impact from unrealized FX and commodity derivatives, which in contrast, were margin accretive in the prior year period. This impacted the gross margin in all business areas.
Income from operations
Income from operations amounted to $1,780 million, increasing 21% from last year and reflecting a margin of 20.4%, up by 40 basis points. The year-on-year earnings increase was the net outcome of higher operational result, which was partially offset by the combined adverse effects of $235 million from higher expenses linked to mark-to-market of unrealized FX and commodity derivatives, other nonoperational items like fair value adjustments of equity investments mainly in Motion and E-mobility, as well as some higher Restructuring and restructuring-related expenses mainly in the Electrification business area.
Operational EBITA
Operational EBITA increased by 37% (28% in local currencies) to $2,049 million, representing a margin of 23.5%. The margin improved by 320 basis points year-on-year, out of which 250 basis points were attributable to the net impact of the gains on sale of real estate, and a robust 70 basis points was driven mainly by improved business performance.
The higher business result was primarily due to operational leverage on higher volumes, which combined with positive pricing more than offset the higher expenses for commodities and tariffs, Research and Development (R&D) and Selling, general & administrative (SG&A). SG&A reduced in relation to revenues to 19.2% from last year’s 20.8%.
Operational EBITA in Corporate and other amounted to $235 million compared with last year’s loss of $6 million. This is the total of underlying Corporate costs of $95 million which includes Stranded costs of $26 million, the capital gain of $377 million linked to the real estate sale and a loss of $47 million in the E-mobility business.
Finance net
Net finance income contributed $20 million to results, higher compared with last year’s $11 million.
Income tax
Income tax expense was $467 million and effective tax rate 25.7%.
Net income and earnings per share
Net income attributable to ABB was $1,324 million, up 20% year-on-year, with the key drivers being contribution from improved business performance and the higher recorded capital gain. These benefits more than compensated for Discontinued operations moving to a loss, compared with recording a profit in the prior year period. Basic earnings per share increased by 21% to $0.73, up from $0.60 last year
Balance sheet & Cash flow
Trade net working capital1
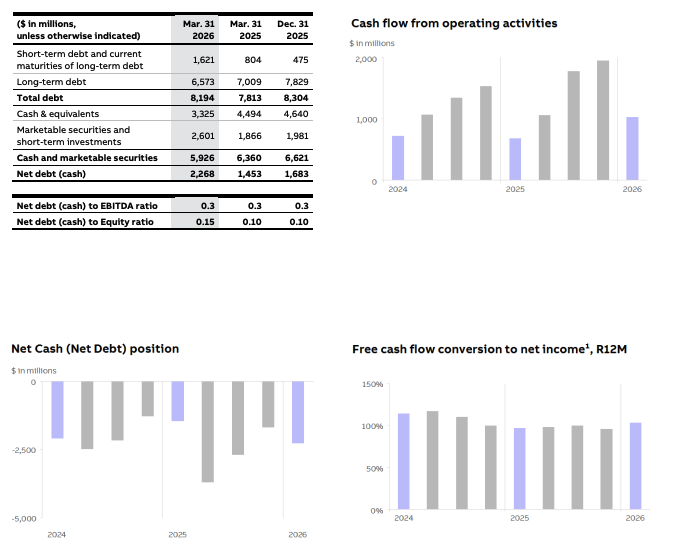
Trade net working capital amounted to $4,017 million, down year-on-year from $4,222 million. The decrease from last year was led by operational improvements across the Trade net working capital components, driven by accounts payables and customer advances. The average trade net working capital as a percentage of revenues1 was 12.5%, a reduction from 14.1% one year ago.
Capital expenditures
Purchases of property, plant and equipment and intangible assets for continuing operations during the first quarter amounted to $181 million, in line with last year’s $183 million. For ABB Group, the total cash outflow on a combined basis amounted to $216 million, higher than last year’s $195 million.
Net debt
Net debt1 amounted to $2,268 million at the end of the quarter. This represents an increase from last year’s level of $1,453 million and sequentially from $1,683 million in the fourth quarter, mainly due to the timing of the dividend payment.
Cash flows
Cash flow from operating activities during the first quarter was $1,029 million, an increase of 50% from last year’s $684 million. Contribution to the strong cash flow derived from an improvement in Continuing operations, supported by stronger earnings as well as a larger reduction in Trade net working capital, year-on-year. Free cash flow amounted to $1,250 million, reflecting a strong improvement from last year’s $652 million, additionally supported by cash contribution from higher proceeds received from the real estate sale.
Share buyback program
A share buyback program of up to $2 billion was launched on February 9, 2026, after the previous program of up to $1.5 billion was completed on January 28, 2026. During the first quarter, under the new program, ABB repurchased a total of 2,610,604 shares for a total amount of approximately $225 million. At the end of the first quarter, ABB’s total number of issued shares, including shares held in treasury, amounts to 1,843,899,204.
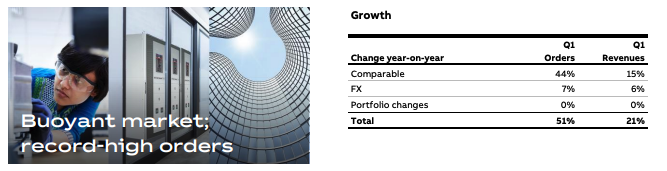
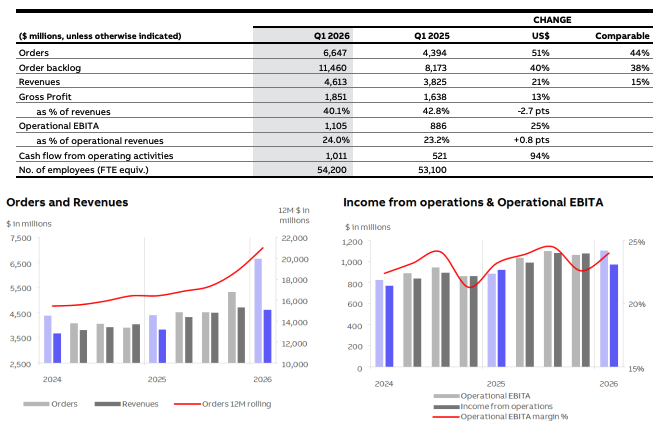
Electrification
Orders and revenues
Strong performance in buoyant market dynamics resulted in record-high orders of $6,647 million. Total growth of 51% was driven by comparable orders up 44%, with further support of 7% from changes in exchange rates.
- Double-digit order growth in virtually all divisions is testimony to the ongoing energy expansion with electricity as the key power source. Strong growth was recorded in both short-cycle and project-businesses. Book-to-bill was 1.44, increasing the order backlog by 40% (38% comparable) to $11.5 billion.
- All main customer segments recorded double-digit order growth, and data centers by as much as triple digits on broad strong demand and a low comparable. Utilities customers continue to invest in power reliability and accessibility, while upgrades for a more efficient electrical infrastructure supported order growth in land-based infrastructure. Buildings was strong driven by the commercial segment, but residential also improved on good execution in a generally still muted market.
- The Americas increased by 82% (80% comparable). Europe was up by 35% (20% comparable). Asia, Middle East and Africa improved by 26% (22% comparable) including 20% (12% comparable) in China.
- Revenues exceeded expectations due to higher demand in the short-cycle businesses. All divisions improved with volumes as the main driver, with added support from positive price management. In total, revenues amounted to $4,613 million, up 21%; the total of 15% comparable growth and 6% from changes in exchange rates.
Profit
Strong increase of 25% (17% in local currencies) in Operational EBITA to $1,105 million, representing a margin improvement of 80 basis points to 24.0%.
- Gross margin decline of 270 basis points was for the vast majority linked to the impact of unrealized FX and commodities derivatives.
- Increase in Operational EBITA margin was supported by:
- Operational leverage on higher volumes and operational efficiency improvements.
- As expected, pricing did not yet fully offset higher expenses for raw materials and tariffs.
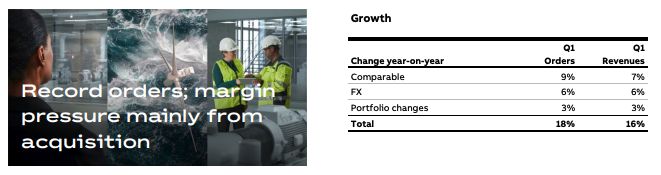
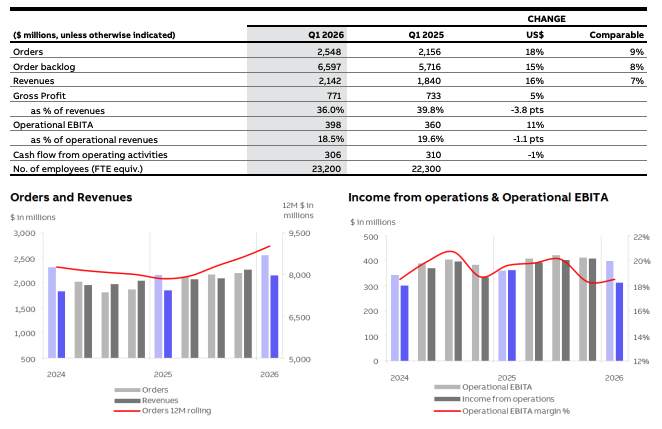
Motion
Orders and revenues
Record-high order intake of $2,548 million was up 18%. Notably, 9% comparable growth was the main driver supported by positive development in virtually all divisions. Additionally, portfolio changes added 3% linked to the Gamesa power electronics deal. And lastly, favorable exchange rates provided material support of 6%.
- From a segment perspective, HVAC for commercial buildings continues to be strong. Power investments in grid stabilization increased. Food & beverage was positive, as was metals with positive demand for the High Power division offering. Rail orders declined in the quarter, although the general market remains robust. Chemicals remained weak.
- The Americas was up 22% (11% comparable), with strong improvement of 25% (14% comparable) in the United States. Europe increased 17% (5% comparable) and Asia, Middle East and Africa was up by 16% (13% comparable), with China at 9% (4% comparable).
- Revenues amounted to $2,142 million, up 16% in total. Looking at the different components, strong comparable growth of 7% was driven mainly by higher volumes as well as positive price management. Portfolio changes added 3% as well as a material impact of 6% from changes in exchange rates.
Profit
Operational EBITA increased by 11% to $398 million, with the margin decline of 110 basis points to 18.5% due mainly to portfolio changes.
- Gross margin declined by 380 basis points with about half the impact linked to unrealized FX and commodities derivatives.
- Operational EBITA margin was supported by the strong comparable revenue increase, more than offset by
- Dilution of 70 basis points from the Gamesa power electronics acquisition included now for the full quarter.
- About 15 basis points dilution from operational inefficiencies in the High Power division, which are expected to be resolved in the second half of 2026.
- Adverse mix from higher share of revenues from the backlog-driven project business.
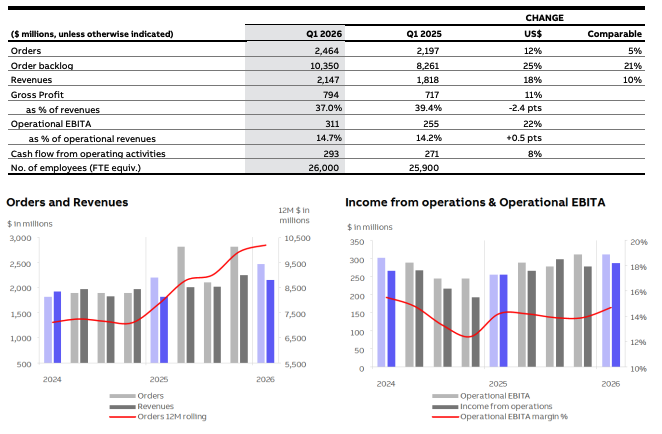
Automation
Orders and revenues
Demand was overall robust and as of yet without material impact from the Middle East conflict visible in numbers. However, in this specific region the conflict caused market uncertainty and some disruption towards the end of the quarter. In total, book-to-bill was 1.15 making this the fifth consecutive positive quarter, restoring its previously strong track record disrupted by a challenging 2024 in the Machine Automation division. Orders reached $2,464 million, up 12%, which is the combined effect of a strong comparable growth of 5% and a significant support of 7% from FX changes.
- Overall robust order growth was supported by persistantly high customer activity in marine, as well as port automation and electrification. Orders from machine builders also increased sharply. Sentiment in oil & gas was overall solid, although quarterly orders declined on a high comparable. For demand linked to process industries, mining orders increased slightly, while areas like pulp & paper, chemical and metals declined. Activity among nuclear customers increased.
- Revenues reached $2,147 million, up 18% year-on-year, supported by positive performance across all divisions. Comparable growth of 10% was overall supported across its core components, led by volumes. Deliveries exceeded our original expectations particularly in our marine systems business and parts of the service business. Currency fluctuations contributed an additional 8% to reported growth. Despite strong revenue momentum, order backlog reached $10.4 billion, up 25% (21% comparable).
Profit
Operational EBITA improved by 22% (11% in local currencies) to $311 million, reflecting a margin improvement of 50 basis points to 14.7%. The impact from a lower gross margin was more than offset by stringent SG&A cost control.
- Gross margin pressure of 240 basis points. This was the net of positive impacts from higher volumes and pricing being more than offset by counter effects from business mix as the backlog-driven systems business represented a higher share of revenues. There was also year-on-year margin dilution from unrealized FX and commodity derivatives.
- While R&D and SG&A spend increased, it reduced in relation to revenues to a combined 23.8% from 25.8% last year, supporting the Operational EBITA margin.
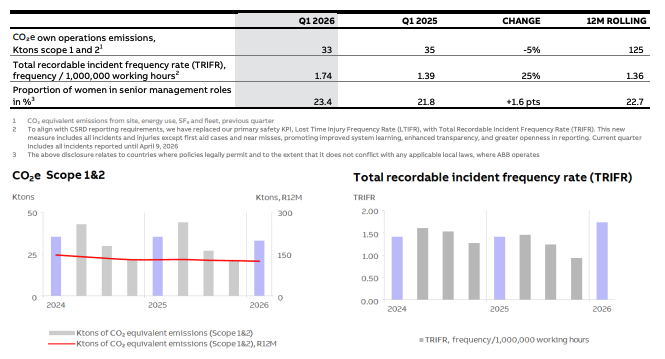
Sustainability

Events from the quarter
- ABB is advancing Europe’s energy transition while strengthening grid reliability. In the Netherlands, Enexis deployed 150 UniGear ZS1 medium-voltage switchgear panels to modernize its electricity grid, enhancing safety and resilience for renewable energy integration. In Germany, utility EnBW commissioned ABB’s Secondary Skid Units at its Gundelsheim solar park supporting the generation of 58 million kWh annually and eliminating ~54,700 tons of CO₂e yearly. ABB’s SSUs are a complete solution designed for solar applications and allowed EnBW to optimize costs and resources while meeting all regulatory requirements.
- Heating and cooling account for nearly half of Europe’s final energy consumption. A partnership that combines ABB’s HVAC application-specific drive technology with Skadec LT’s system expertise in heat pump design, ABB and Skadec contribute to advancing efficient, reliable heating solutions for European markets. As demand for electrified heating continues to grow, partnerships that bridge component innovation and system-level integration will play a key role in supporting Europe’s transition toward a more energy-efficient and resilient energy landscape.
- ABB has been selected by Bruce Power to supply advanced excitation technology that will help extend the life, reliability and efficiency of eight units at the Bruce Nuclear Generating Station in Ontario – one of Canada’s largest sources of low-carbon electricity. Nuclear provides 15% of Canada’s electricity and 53% of Ontario’s power mix. This underscores ABB’s nuclear expertise and commitment to extending critical infrastructure supporting Canada’s energy independence and decarbonization targets.
- ABB launched its first fully integrated gas analyzer package for Carbon Capture, Utilization and Storage (CCUS) applications. The solution facilitates complete CO₂ stream quality assurance across capture, transport, and storage. Designed for hard-to-abate industries including cement, chemicals, and power generation, the turnkey system simplifies procurement and ensures compliance with strict purity standards. Backed by global service networks and AI-powered asset monitoring, the solution supports industrial decarbonization while protecting pipeline integrity.
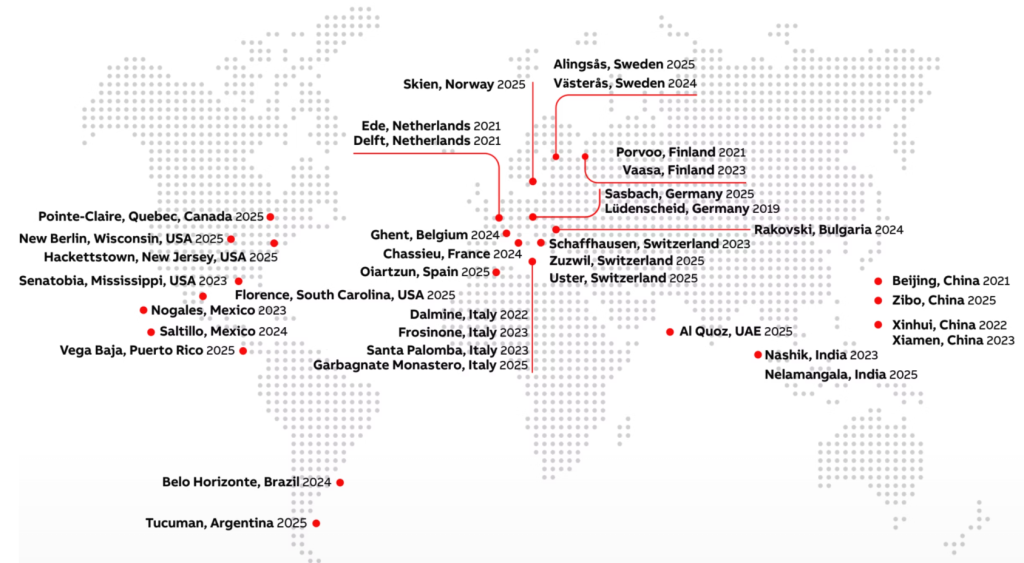
- ABB has made further progress with its Mission to Zero™ initiative, the company’s journey to achieve net-zero emissions in its own operations. For example, the Sasbach facility in Germany, is implementing a data-led decarbonization roadmap focused on energy efficiency, renewable electricity and smart energy management. Separately, the production facility in Zibo, China, is delivering measurable energy and emissions reductions through advanced digital energy management and electrification solutions. The site has cut energy consumption by 71 MWh which allowed to avoid over 63 tons of CO₂e emissions already in 2025 – equivalent to the electricity needed to power several hundred average homes for a month. Other sites in Spain and Argentina also progressed their efforts. Currently, 37 ABB sites are recognized to meet Mission to Zero™ requirements.
Significant events
During Q1 2026
- On February 9, 2026, ABB announced it had launched its share buyback program of up to $2.0 billion. Based on the share price at the time this represents a maximum of approximately 23.2 million shares. The new share buyback program is for capital reduction purposes and will be executed on a second trading line on the SIX Swiss Exchange. It is planned to run until January 27, 2027.
- On March 19, 2026, ABB shareholders approved all proposals at the Annual General Meeting held in Zurich, Switzerland.
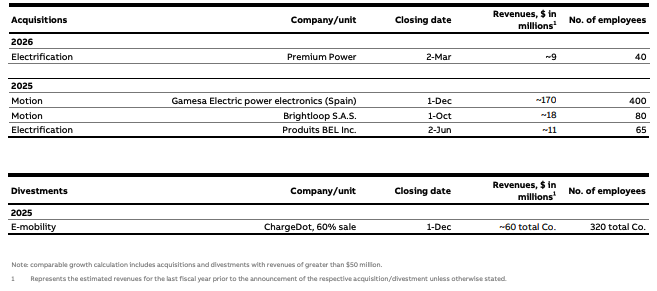
Key acquisitions and divestments, last twelve months
Additional figures
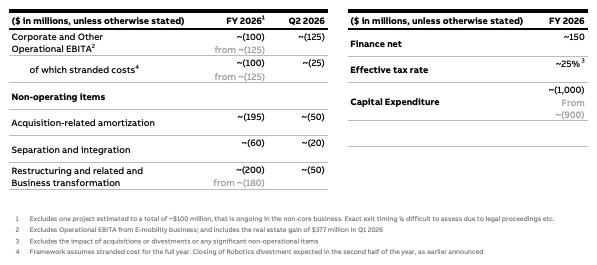
Additional 2026 guidance
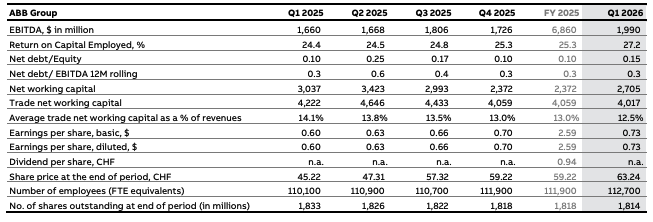
ABB based on discontinued operations structure
Important notice about forward-looking information
This press release includes forward-looking information and statements as well as other statements concerning the outlook for our business, including those in the sections of this release titled “CEO summary,” “Outlook,” “Sustainability” “Significant events” and “Additional 2026 guidance”. These statements are based on current expectations, estimates and projections about the factors that may affect our future performance, including global economic conditions and the economic conditions of the regions and industries that are major markets for ABB. These expectations, estimates and projections are generally identifiable by statements containing words such as “anticipates,” “expects,” “estimates,” “intends,” “plans,” “targets,” “guidance,” or similar expressions. However, there are many risks and uncertainties, many of which are beyond our control, that could cause our actual results to differ materially from the forward-looking information and statements made in this press release and which could affect our ability to achieve any or all of our stated targets. These include, among others, business risks associated with the volatile global economic environment and political conditions, market acceptance of new products and services, changes in governmental regulations and currency exchange rates. Although ABB Ltd believes that its expectations reflected in any such forward looking statement are based upon reasonable assumptions, it can give no assurance that those expectations will be achieved.
Q1 results presentation on April 22, 2026
The Q1 2026 results press release and presentation slides are available on the ABB News Center at www.abb.com/news and on the Investor Relations homepage at www.abb.com/investorrelations.
A conference call and webcast for analysts and investors is scheduled to begin at 10:00 a.m. CET. To join the webcast, please refer to the ABB website: www.abb.com/investorrelations.
The recorded session will be available after the event on ABB’s website.
Financial calendar
2026
- July 16 Q2 2026 results
- October 20 Q3 2026 results
SourceABB
EMR Analysis
More information on ABB: See full profile on EMR Executive Services
More information on Peter Voser (Chairman of the Board of Directors, ABB Ltd + Chairman of the Governance and Nomination Committee, ABB Ltd): See full profile on EMR Executive Services
More information on Morten Wierod (Chief Executive Officer and Member of the Group Executive Committee, ABB): See full profile on EMR Executive Services
More information on Christian Nilsson (Chief Financial Officer and Member of the Executive Committee, ABB): See full profile on EMR Executive Services
More information on the ABB Way: See full profile on EMR Executive Services
More information on the ABB Sustainability Strategy: See full profile on EMR Executive Services
More information on Karin Lepasoon (Chief Communications and Sustainability Officer and Member of Executive Committee, ABB): See full profile on EMR Executive Services
More information on Anke Hampel (Group Head of Sustainability, ABB): See full profile on EMR Executive Services
More information on Mission to Zero™ by ABB: https://global.abb/topic/mission-to-zero/en + ABB’s Mission to Zero program offers a scalable blueprint for smart building solutions, incorporating on-site renewable energy generation and storage. One of the primary objectives is to generate adequate clean energy on-site, resulting in zero emissions while powering day-to-day operations.
The program began as a pilot in 2019 with our plant in Lüdenscheid, Germany.
More information on Electrification Business Area by ABB: See the full profile on EMR Executive Services
More information on Giampiero Frisio (President, Electrification Business Area and Member of the Executive Committee, ABB): See full profile on EMR Executive Services
More information on Motion Business Area by ABB: See the full profile on EMR Executive Services
More information on Brandon Spencer (President, Motion Business Area and Member of the Executive Committee, ABB): See full profile on EMR Executive Services
More information on Gamesa Electric by Motion Business Area by ABB: https://www.gamesaelectric.com/ + Gamesa Electric is a worldwide leader in the design and manufacturing of electrical equipment, with extensive experience in photovoltaics, hydro-electric energy, marine propulsion, wind power and energy storage applications, among others.
In April 2017, Gamesa merged Siemens Wind to form Siemens Gamesa Renewable Energy. Gamesa Electric is a 100% subsidiary of this merged company.
More information on Juan Barandiaran (Managing Director, Gamesa Electric, Renewable Power, Motion High Power Division, Motion Business Area, ABB): See the full profile on EMR Executive Services
More information on Automation Business Area by ABB: See the full profile on EMR Executive Services
More information on Peter Terwiesch (President, Automation Business Area and Member of the Executive Committee, ABB): See full profile on EMR Executive Services
More information on the SIX Swiss Exchange: https://www.six-group.com/en/home.html + SIX operates the infrastructure for the financial centers in Switzerland and Spain, thus ensuring the flow of information and money between financial market players. SIX offers exchange services, financial information and banking services with the aim of increasing efficiency, quality and innovative capacity along the entire value chain. SIX is also building a digital infrastructure for the new millennium.
SIX connects financial market participants in Switzerland, Spain and throughout the world. The company is owned by around 120 national and international financial institutions. They are the main users of our services and our most important customers. Our close relationship with them guarantees stability of the financial infrastructure and processes, proximity to clients’ evolving business needs and competitive prices.
More information on Bjørn Sibbern (Chief Executive Officer, SIX Swiss Exchange): https://www.six-group.com/en/company/governance/executive-board.html + https://www.linkedin.com/in/bj%C3%B8rnsibbern/
More information on the Carbon Disclosure Project (CDP): https://www.cdp.net/en + CDP is a global non-profit that runs the world’s only independent environmental disclosure system for companies, capital markets, cities, states and regions to manage their environmental impacts.
Founded in 2000, CDP was the first organization to leverage investor pressure to influence corporate disclosure on environmental impact. Now with the world’s largest, most comprehensive dataset on environmental action, the insights that CDP holds empower investors, companies, cities, and national and regional governments to make Earth-positive decisions.
As the founder of environmental reporting, we believe in transparency and the power of data to drive change. Partnering with leaders in enterprise, capital, policy and science, we surface the information needed to enable Earth-positive decisions.
We helped more than 22,100 companies and almost 1,000 cities, states and regions disclose their environmental impacts in 2024. Financial institutions with more than a quarter of the world’s institutional assets use CDP data to help inform investment and lending decisions. Aligned with the ISSB’s climate standard, IFRS S2, as its foundational baseline, CDP integrates best-practice reporting standards and frameworks in one place. Our team is truly global, united by our shared desire to build a world where people, planet and profit are truly balanced
Disclosers are evaluated across four scoring levels, representing stages of environmental maturity:
- Disclosure (D/D–): Measures the completeness of a company’s reporting. The number of points allocated to each question depends on both the amount of data requested and their relative importance to data users.
- Awareness (C/C–): Reflects the understanding of how environmental issues relate to the company’s activities and impacts. This level indicates awareness but not yet action.
- Management (B/B–): Recognizes evidence of action and processes to manage environmental issues, showing that the company is moving from understanding to implementation.
- Leadership (A/A–): Represents best practice performance, where the Discloser demonstrates environmental leadership through ambitious strategies, verified progress, and sector-leading action.
More information on Paul Dickinson (Founder Chair, Carbon Disclosure Project (CDP) + Co-Founder, Transition Value Partners (TVP)): https://www.transition-value.com/about + https://www.linkedin.com/in/paul-dickinson-0093a8/
More information on Sherry Madera (Chief Executive Officer, Carbon Disclosure Project (CDP)): https://www.cdp.net/en/about/team + https://www.linkedin.com/in/sherrymadera/
EMR Additional Financial Notes:
- Major financial KPI’s since 2017 are available on EMR Executive Services under “Financial Results” and comparison with peers under “Market Positioning”
- Companies’ full profile on EMR Executive Services are based on their official press releases, quarterly financial reports, annual reports and other official documents.
- All members of the Executive Committee and of the Board have their full profile on EMR Executive Services
- The ABB Q1 2026 Financial Information can be found here: https://library.e.abb.com/private/e06917a69e6649928af192ed54414522/ABB-Q1-2026-financial-information.pdf
- The ABB Q1 2026 Results Presentation can be found here: https://resources.news.e.abb.com/attachments/published/135137/en-US/E927A561C202/ABB-Q1-2026-Group-results-presenation.pdf
- The ABB Integrated Report 2025 can be found here: https://library.e.abb.com/public/9fd453fc1a924f16ac229a03af593ab0/ABB%20Integrated%20Report%202025.pdf
- The ABB Q4 2025 Full Year Financial Information can be found here: https://library.e.abb.com/public/efa424a5e55545ef99275bfafc6ff638/ABB-Q4-2025-financial-information.pdf
- The ABB Q4 2025 Full Year Results Presentation can be found here: https://library.e.abb.com/public/17c5f84dedb946478c22ba1e00f5673e/ABB-Q4-2025-press-release-English.pdf
- The ABB Integrated Report 2024 can be found here: https://library.e.abb.com/public/6fe759d28f0d4261b6c4a8ab21275fe3/ABB%20Integrated%20Report%202024.pdf
- The ABB Q4 2024 Full Financial Information can be found here: https://library.e.abb.com/public/daae2758e6a546efab24d3967aaa0f37/ABB-Q4-2024-financial-information.pdf
- The ABB Q4 2024 Group Results Presentation can be found here: https://library.e.abb.com/public/4e87bd89e0c541ed857d8085f22e7f61/ABB-Q4-2024-presentation.pdf
- The ABB Integrated Report 2023 can be found here: https://library.e.abb.com/public/8fe35c6a0c3943d5aacc783ce0ffaf3b/ABB%20Integrated%20Report%202023.pdf
- ABB Q4 2023 Full Financial Report can be found here: https://library.e.abb.com/public/9d87fae42fab43c297c4ee385296fd05/ABB-Q4-2023-financial-information.pdf
- ABB Q4 2023 Results Presentation Report can be found here: https://library.e.abb.com/public/0834f841fe5a4829bd9ce21ad23d8f70/ABB-Q4-2023_Group%20presentation.pdf
- ABB Q4 2022 Full Financial Report can be found here: https://library.e.abb.com/public/0c911f20f7cc46848b2e64bde82fb4f5/ABB-Q4-2022-financial-information.pdf
- ABB Q4 2022 Group Results Presentation can be found here: https://library.e.abb.com/public/63461737ba8345e3aa6d2461f06fc72d/ABB%20Q4%202022%20Group%20results%20presentation.pdf
- The ABB Integrated Report 2022 can be found here: https://library.e.abb.com/public/ef5852f1e2e54cad97abcc4fc48d1d58/Annual%20Reporting%20Suite_Integrated%20Report%202022_English.pdf
- The ABB Annual Report 2021 can be found here: https://library.e.abb.com/public/c6dae9af148d4d5fb87efc97bb4b460a/ABB-Group-Annual-Report-2021-English.pdf