Schneider Electric – Schneider Electric full year 2025 results

Record FY25 performance with all-time high revenues and free cash flow; Entering the next cycle with strong momentum in both businesses
Financial Highlights
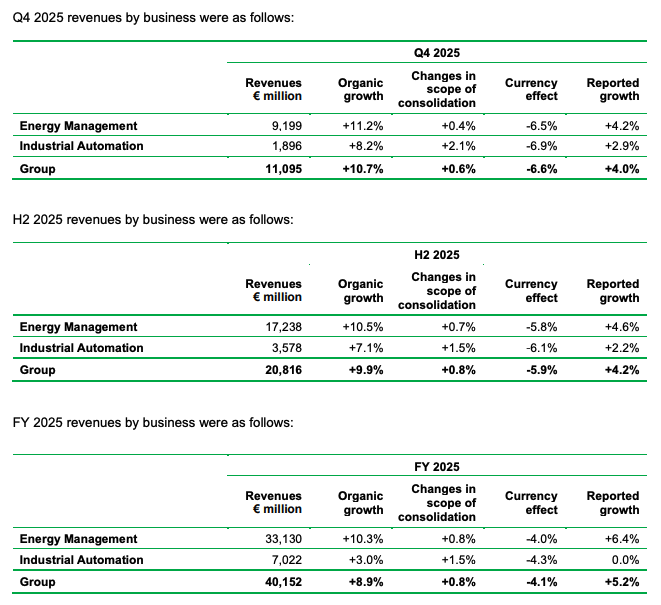
- Q4’25 revenues up +11% organic to €11 billion, a record high quarter
- Energy Management up +11% org., led by Data Center
- Industrial Automation up +8% org., with continued recovery in Discrete automation
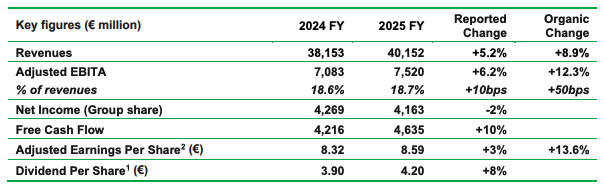
- FY25 revenues up +9% organic, crossing €40 billion for the first time
- Energy Management up +10% organic
- Industrial Automation up +3% organic
- All four regions contribute to growth, led by North America up +15% organic
- Adj. EBITA of €7.5 billion at 18.7%, up +12% organic
- Continued strong progression in adj. EBITA margin of +50bps org., accelerating in H2
- Net Income of €4.2 billion, down -2%
- Record Free Cash Flow of €4.6 billion, up +10%; Cash Conversion from Net Income at 111%
- Progressive dividend1 at €4.20/share, up +8%
- Completion of 2021-25 Schneider Sustainability Impact program with a score of 8.86
- FY26 Target: Adj. EBITA org. growth between +10% to +15%, driven by +7% to +10% org. revenue growth and +50bps to +80bps org. Adj. EBITA margin improvement
1. Subject to Shareholder approval on May 7, 2026
2. See appendix Adjusted Net Income & Adjusted EPS
Olivier Blum, Chief Executive Officer, commented: “2025 was a milestone year. We delivered record revenues, expanded adjusted EBITA margin despite volatility, and generated our highest free cash flow, with strong execution, particularly in H2. End‑market demand accelerated sharply in Q4, led by Data Centers as well as Industry and Infrastructure, confirming our strong strategic positioning, balanced exposure and portfolio strength. We successfully concluded our 2021–25 Schneider Sustainability Impact program, and our new 2030 Sustainability roadmap demonstrates our continued commitment to raise ambitions and power progress for all.
At our 2025 Capital Markets Day, we set a clear five‑year ambition: sustainable, high‑quality growth and operational excellence within a disciplined financial framework. We are ‘Advancing Energy Tech’ to the next level with our unique portfolio in electrification, automation and digital, driving energy and industrial intelligence in all our markets. We enter this cycle confident in sustained growth, margin expansion, and value creation. We set our FY26 target for adjusted EBITA organic growth of +10% to +15%, driven by structural mega-trends and operational excellence, supported by our strong backlog, innovation pipeline and more recurring mix.”
I. ORGANIZATIONAL UPDATE
Schneider Electric today announces that Hilary Maxson, Chief Financial Officer, will be leaving on April 5th, 2026 to take her next professional opportunity in the U.S.
“During her time with Schneider Electric, Hilary has made significant contributions to our company and helped to build our Energy Tech mission. On behalf of Schneider Electric, I thank Hilary for her commitment and leadership. She has been a valued member of our Executive Committee, and I thank her for organizing a smooth transition” said CEO Olivier Blum.
“I am very grateful for my time at Schneider Electric, and proud for what we have accomplished together. It has been a privilege, and I want to thank the entire Schneider Electric team for their unwavering support.” said Hilary Maxson.
Hilary Maxson joined Schneider Electric in May 2017, as SVP Finance for the Energy Management Business.
A thorough internal and external search has been conducted for this critical role, with the support of a third party executive search firm. After careful review, and with the full support of the Board of Directors, Olivier Blum has made the decision to appoint Nathan Fast as the new Chief Financial Officer, effective April 6th, 2026.
Nathan, a U.S. citizen, joined Schneider Electric in 2007 and currently serves as the Head of Investor Relations.
“I am very excited to welcome Nathan as the new Chief Financial Officer of Schneider Electric. He brings broad and diversified finance leadership expertise, built both inside our organization with roles such as SVP Finance Global Supply Chain and SVP Group Controlling & Reporting and externally at EY and Deloitte. With experience living and working in the U.S., Canada, and France, he brings a truly global perspective. I look forward to working with him to advance Energy Tech and deliver strong returns for our shareholders” said CEO Olivier Blum.
II. FOURTH QUARTER REVENUES WERE UP +11% ORGANIC
2025 Q4 revenues were €11,095 million, up +10.7% organic and up +4.0% on a reported basis.
Q4 2025 PERFORMANCE BY BUSINESS MODEL
Products (47% of FY25 revenues) grew +4% organic in Q4. Growth was balanced between volume and price, with pricing led by North America in response to tariffs and supported by Rest of the World in response to inflation, partly offset by deflation in China. Product revenues grew mid-single digit in Energy Management, contrasted between strong growth in electrical power distribution across multiple end-markets and continued weakness in the Residential buildings market in North America and China. Product revenues in Industrial Automation were also up mid-single digit with growth in many product categories and across many geographies, as the steady recovery of recent quarters continued to broaden in Q4.
Systems (34% of FY25 revenues) grew +19% organic in Q4. Energy Management saw strong double-digit growth with contributions across end-markets, most notably in Data Center, where sales of the Group’s prefabricated offer were particularly strong, alongside other elements of the full solution offered by the Group. Industrial Automation systems sales grew double-digit. Discrete automation markets saw strong growth in motion and PLC for packaging OEMs; there was also strong growth in medium voltage drives for customers in the Infrastructure and Industry end-markets. Process & Hybrid automation markets were around flat due to demand weakness earlier in the year, which has improved but is not yet reflected in sales growth.
Software & Services (19% of FY25 revenues) grew +10% organic in Q4, of which Software & Digital Services (8% of FY25 revenues) grew +13% organic and Field Services (11% of FY25 revenues) grew +8% organic
- Agnostic Software (comprising AVEVA, ETAP and RIB Software)
- AVEVA delivered good growth in Annualized Recurring Revenue (ARR), up +12% as of December 31, 2025. ARR growth was driven by upsell to existing customers, while net new logos contributed positively, with churn remaining low. Strong organic growth was led by SaaS and on-premise rental, while the perpetual license share continued to decline as expected. Segments contributing to growth included Food & Beverage, Energy & Chemicals, Transportation, Power & Grid and through distribution channels.
- Energy Management agnostic software offers (ETAP and RIB Software) delivered mid-single digit organic sales growth. The Group’s eCAD offer (ETAP) led the organic growth performance with strong uptake for multi-year on-premise rental contracts, while perpetual license revenues declined, as expected. The Group’s software offer for the construction market (RIB Software) also grew, seeing strong growth in on-premise rental, while SaaS growth was impacted by timing of renewals, despite the continued transition from perpetual license to subscription.
- Services (comprising Digital and Field Services offers) grew double-digit organic in Q4
- Field Services grew +8% organic in Q4, with high-single digit growth in Energy Management and low single digit growth in Industrial Automation. In Energy Management, growth was across end-markets notably from Data Center, capturing demand across the lifecycle, from commissioning to modernization and maintenance.
- Digital Services delivered double-digit organic growth in Q4, where there was double-digit growth in EcoStruxure Advisors, digital offers for Grid customers and Cybersecurity solutions, which more than offset softness in sustainability.
Q4 2025 PERFORMANCE BY END-MARKET
Schneider Electric sells its integrated portfolio into four end-markets: Data Center & Networks, Buildings, Industry and Infrastructure, leveraging the unique combination of Energy Management and Industrial Automation complementary offers and technologies supported by the focus on electrification, automation and digitalization to enable a sustainable future.
- Data Center & Networks – Demand in the pure Data Center segment accelerated sharply, with triple-digit growth year-over-year in Q4. This was particularly apparent with hyperscale and colocation customers who strongly accelerated investments in the quarter, and demand was also strong with other customer groups. Demand was strongest in North America with a strong pickup in demand in other geographies as well, including France, the Nordics and parts of the Asia Pacific region. The Group provides customers in the Data Center end-market with a broad offer and saw a strong uptake for the Group’s electrical panels, UPS, racks, prefabricated solutions and liquid cooling. Sales growth in pure Data Center remained at a strong double-digit level, year-over-year in Q4. In the Distributed-IT segment, demand in the quarter was good, while sales declined slightly, primarily due to weaker performance in the B2C segment in North America.
- Buildings – Demand in the Buildings end-market was around flat during the quarter, although sales growth remained good. In the Non-residential buildings market, demand was solid, particularly in technical buildings such as public access buildings, healthcare and hotels, where modernization of building management and power management technologies continues to drive growth. Sales into Non-residential buildings remained strong. Residential building demand declined during the quarter, though varied by country with some signs of stabilization in North America, while the market in China remained weak. Sales into Residential buildings were around flat.
- Industry – In Q4, the Industry end-market saw strong demand overall, including for offers of both businesses. In Discrete automation, the market recovery continued, with strong demand against a low base of comparison, led by machinery manufacturers, including strong automation demand in U.S., India and parts of Western Europe. Other industrial manufacturing also saw strong demand. There was good sales growth into Discrete automation markets in the quarter. In Process & Hybrid industries, demand was strong, where in particular, the Energies & Chemicals (E&C) and Semiconductor segments saw strong traction, despite continued macroeconomic uncertainty. Sales growth into Process & Hybrid markets was relatively weaker than Discrete due to demand weakness earlier in the year.
- Infrastructure – The Infrastructure end-market saw strong and accelerating demand in the quarter. There was strong demand in the Power & Grid (P&G) segment, across many geographies underpinned by electrification momentum, aging infrastructure, and rising grid expansion requirements driven by energy decentralization. There was solid sales growth in the P&G segment in the quarter. There was strong demand in Water & Wastewater (WWW) including several notable projects in the U.S., Europe and Middle East & Africa, while sales declined against a high base of comparison.
Q4 2025 PERFORMANCE BY BUSINESS AND GEOGRAPHY
The breakdown of revenue by business and geography was as follows:
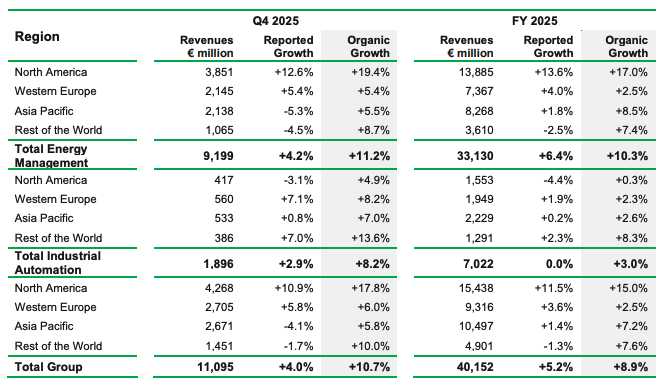
North America (39% of FY 2025 revenues) grew +17.8% organic in Q4.
Energy Management grew +19.4% organic. The U.S. grew strong double-digit despite a high base of comparison. Recent capacity investment supported enhanced volumes, while price realization improved in the quarter. The Data Center end-market led growth, where the Group has strong traction due to its comprehensive portfolio, while the Industry and Infrastructure end-markets also contributed. Services saw high single-digit growth supported by increased attach rates in Data Center and modernization projects in other end-markets. Weakness in Residential and Distributed IT segments was compensated by good traction for new channel partner programs across other segments. Canada was down mid-single digit against a strong double-digit base of comparison due to Data Center projects executed in Q4’24, and with continued weakness in Residential buildings, partly offset by growth in the Industry and Infrastructure end-markets. Mexico was down sharply, in part due to the uncertain macroeconomic environment while also facing a high base of comparison.
Industrial Automation grew +4.9% organic. The U.S. grew high-single digit overall, aided by prior investments in commercial set-up. Discrete automation grew double-digit against a low base of comparison with good traction in both channel and end-user business in Industry and Infrastructure and with strong growth in services. Process & Hybrid sales were stable, impacted by prior order weakness, while AVEVA grew slightly. Canada grew double-digit despite a high base of comparison, benefitting from selling combined solutions of Energy Management and Industrial Automation to customers in the E&C and Non-residential buildings segments. Mexico was down due to continued macroeconomic uncertainty.
Western Europe (23% of FY 2025 revenues) grew +6.0% organic in Q4.
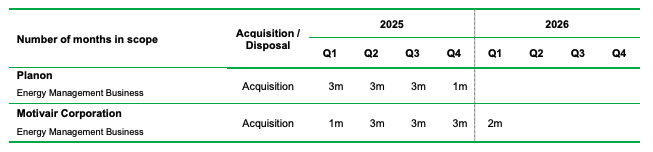
Energy Management grew +5.4% organic. Growth was led by Data Center with good contributions from other segments and end-markets, including Residential buildings which saw solid growth. Among major economies, growth was led by France, up double-digit, with strength across end-markets, notably in Data Center and Residential buildings. Italy and Germany delivered mid-single digit growth supported by project execution across end-markets, notably from Non-residential buildings. The U.K. grew low-single digit, while Spain declined against a high base of comparison. There was high-single digit growth in aggregate across the rest of the region, supported by Data Center project execution in the Netherlands and the Nordics which also saw growth in the Industry end-market. Services grew strongly across the region, mainly linked to Data Center, while also seeing good contribution from recent acquisition Planon (2 months contribution to organic growth).
Industrial Automation grew +8.2% organic, with double-digit growth at AVEVA, boosted by a large, multi-year, on-premise subscription renewal in Switzerland, with mid-single digit growth in Discrete automation and Process & Hybrid. Among major economies, growth was led by Germany, with double-digit growth across Process & Hybrid, led by the Consumer Packaged Goods segment, Discrete automation and AVEVA. The U.K. grew double-digit, primarily due to AVEVA. France, Italy and Spain were down due to renewal timing in Software, despite strong growth in Discrete for Italy and in Process & Hybrid for France. The rest of the region delivered low-single digit growth in aggregate, when excluding the large software renewal in Switzerland.
Asia Pacific (26% of FY 2025 revenues) grew +5.8% organic in Q4.
Energy Management grew +5.5% organic. India grew double-digit with strong contribution across end-markets and business models. China grew low-single digit, with strong growth in Data Centers and traction in Semicon, while construction markets remained weak. Australia declined mid-single digit against a double-digit base of comparison and with Residential buildings slightly negative. The rest of the region grew mid-single digit in aggregate with a particularly strong contribution from Indonesia due to execution on a large data center project, supported by strong growth in Residential buildings in Vietnam and Infrastructure projects in Thailand, while Malaysia declined against a high base of comparison.
Industrial Automation grew +7.0% organic, with double-digit growth at AVEVA, high-single digit growth in Process & Hybrid automation and mid-single digit growth in Discrete automation. China grew low-single digit with good growth in Discrete automation including momentum with OEMs and benefitting from new product launches, while sales into Process & Hybrid markets were down. India grew double-digit with execution on a project in the E&C segment combined with strong growth in Discrete automation. Australia was up double-digit with strong performance in Discrete automation and at AVEVA. The rest of the region grew high-single digit in aggregate with strong performance in Japan and Korea, both seeing good traction in Process and at AVEVA.
Rest of the World (12% of FY 2025 revenues) grew +10.0% organic in Q4.
Energy Management grew +8.7% organic. Middle East & Africa grew double-digit, led by Saudi Arabia and U.A.E. where strong project execution and services drove growth, notably in E&C, Data Center and P&G segments. Turkey and Egypt also saw strong growth in the quarter, driven by an improvement in the market environment in late 2025. South America was down against a strong double-digit base of comparison due to project execution in Chile in Q4’24, though Argentina grew strongly led by project execution in E&C. Central & Eastern Europe grew mid-single digit with strong growth in products, including in Residential buildings.
Industrial Automation grew +13.6% organic. AVEVA delivered strong double-digit growth, led by the E&C segment. Discrete automation grew double-digit, while Process & Hybrid sales were down, with both varied by geography. Middle East & Africa grew double-digit with strong growth in Discrete automation markets and at AVEVA while Process & Hybrid markets were down against a high base of comparison. South America grew strong double-digit led by Process & Hybrid markets with project execution in Brazil and Argentina in the E&C segment, and strong growth at AVEVA, while Discrete automation markets were down slightly. Central & Eastern Europe was down slightly.
SCOPE3 AND FOREIGN EXCHANGE4 IMPACTS IN Q4
In Q4, net acquisitions/disposals had an impact of +€64 million or +0.6% of Group revenues, mainly relating to the acquisition of Motivair, coupled with 1 month scope impact from Planon and the impact of some smaller disposals.
Based on transactions completed to-date, the Scope impact on FY 2026 revenues is estimated to be around flat. The Scope impact on adjusted EBITA margin for FY 2026 is estimated to be around flat.
In Q4, the impact of foreign exchange fluctuations was negative at -€701 million or -6.6% of Group revenues, mostly driven by the weakening of the U.S. Dollar, Indian Rupee and Chinese Yuan against the Euro.
Based on current rates5 , the FX impact on FY 2026 revenues is estimated to be between -€850 million to -€950 million. The FX impact at current rates on adjusted EBITA margin for FY 2026 could be around -10bps.
3. Changes in scope of consolidation also include some minor reclassifications of offers among different businesses.
4. For those currencies meeting the criteria to be considered hyperinflationary under IAS 29, such as Argentina and Türkiye, an IFRS technical adjustment for hyperinflation impact is reflected as FX and therefore excluded from the organic growth calculation. The effect of operational actions taken in these countries such as increased pricing to mitigate the inflationary impact is reflected as part of the organic growth.
5. Forward exchange rates are volatile and difficult to predict. Consequently, the impact of such movement and possible impacts from hyperinflation technical accounting (IAS29) are not factored at this stage.
DIGITAL UPDATE
In 2025, the Digital Flywheel represented 62% of Group revenues (vs. 57% in 2024), showing strong progress towards a target of >70% by 2030, growing at +15% in 2025. All four elements of the Digital Flywheel made a strong contribution to the growth, led by Connectable Products as the Group continues to generate value for customers through the digitalization of its product offering, as a foundation for Advancing Energy Tech. Overall, Software & Services represented 19% of Group revenues in 2025, with an ambition for this representation to reach c.25% by 2030. Digital Services grew strongly, while the Group’s agnostic software offers also made a strong contribution despite their ongoing transition to a subscription model. Recurring revenues within agnostic software increased to 79% (vs. 77% in 2024), led by AVEVA, which achieved close to 85% as outlined in the Group’s 2025 Capital Markets Day. The Group aims to double the weightage of total recurring revenues by 2030.
BACKLOG
The Group closed the year with backlog of €25,362 million (2024: €21,420 million), up +18%. Backlog grew across both businesses, with Energy Management at €21,340 million, up +21%, and Industrial Automation at €4,022 million, up +8%. Backlog grew across all business models, with the most significant increase seen in Systems in North America due to accelerated demand in the Data Center end-market. There was strong growth in backlog to be executed in 2027 and beyond, linked with Data Center, while backlog to be executed in 2026 also grew. This record level of backlog gives the Group unprecedented visibility moving into the next cycle.
III. FULL YEAR 2025 KEY RESULTS
6. See appendix Adjusted Net Income & Adjusted EPS.
ADJUSTED EBITA MARGIN AT 18.7%, UP +50BPS ORGANIC, IMPACTED BY LOWER GROSS MARGIN OFFSET BY A REDUCTION IN SFC / SALES RATIO
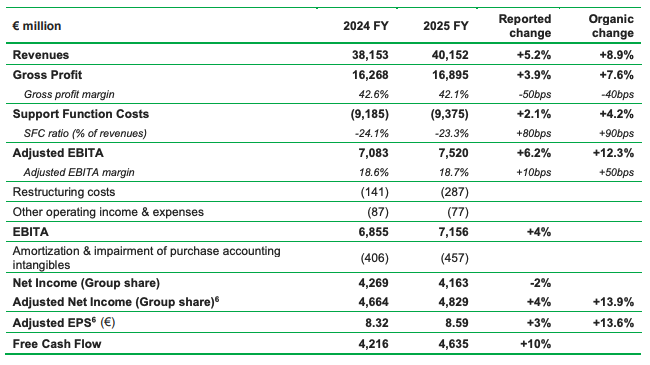
Gross profit was up +7.6% organic with Gross margin down -40bps organic, to be at 42.1% in FY25. The Group delivered strong levels of industrial productivity and saw an acceleration in product pricing in Q4, however this was insufficient to fully offset the Gross margin headwinds from Mix, reflective of continued strong growth in Systems, and raw material cost inflation inclusive of tariffs.
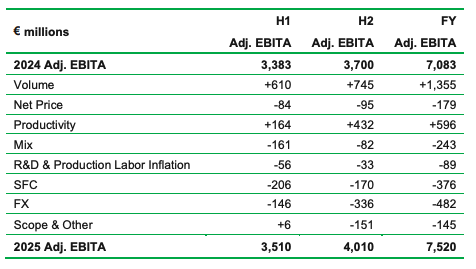
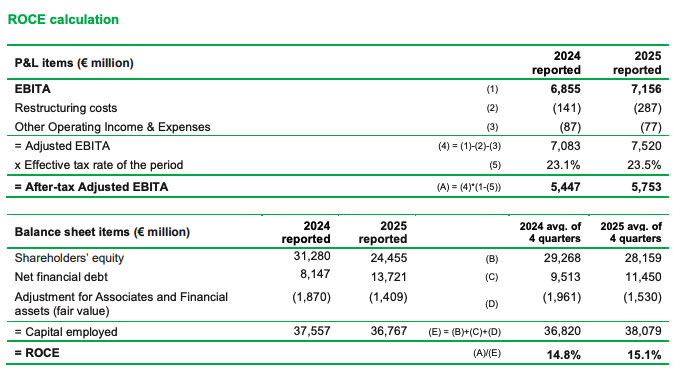
Adjusted EBITA reached €7,520 million, increasing organically by +12.3% and the Adjusted EBITA margin improved by +50bps organic to 18.7% as a consequence of good control over the Group’s discretionary costs despite the negative Gross Margin evolution. SFC costs decreased as a percentage of revenues by +80bps to 23.3%, with a positive organic evolution of +90bps partly offset by FX headwinds.
The key drivers contributing to the earnings change were the following:
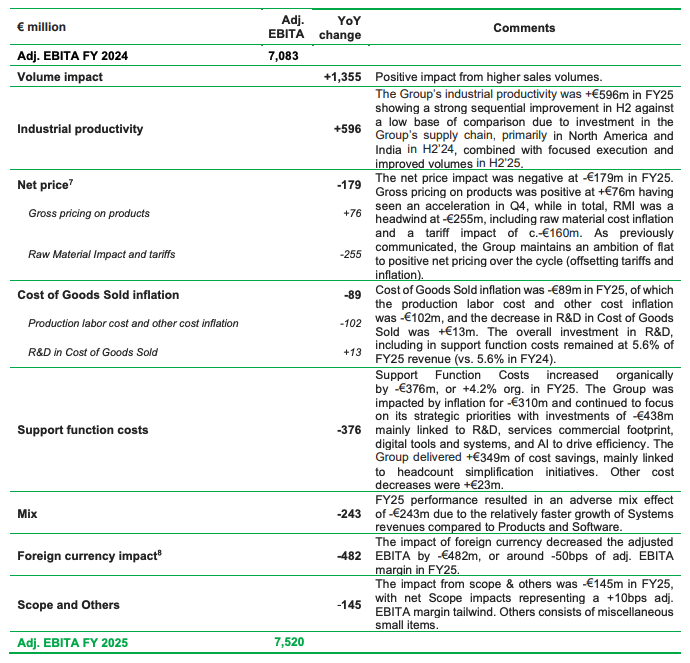
7. Price on products and raw material impact
8. For those currencies meeting the criteria to be considered hyperinflationary under IAS 29, such as Argentina and Türkiye, an IFRS technical adjustment for hyperinflation impact is reflected as FX and therefore excluded from the organic growth calculation. The effect of operational actions taken in these countries such as increased pricing to mitigate the inflationary impact is reflected as part of the organic growth
The FY 2025 adjusted EBITA for each business was as follows:
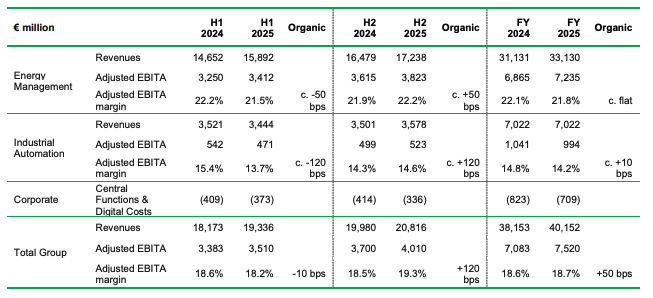
- Energy Management generated an adjusted EBITA of €7,235 million, or 21.8% of revenues, around flat organically (down -30bps reported), where a decline in Gross Margin was driven by negative mix and raw material inflation more than offsetting strong industrial productivity. This was mitigated by an improvement in SFC/Sales ratio, with improved leverage on a strong volume contribution, particularly in Systems.
- Industrial Automation generated an adjusted EBITA of €994 million, or 14.2% of revenues, up c.+10bps organic (down -60bps reported), where an improvement in Gross Margin was driven by strong industrial productivity, positive mix from AVEVA and the recovery in Discrete automation more than offsetting the impact of raw material and other cost inflation. The SFC/Sales ratio in Industrial Automation deteriorated due to the lower volume contribution in the first half of the year.
- Central Functions & Digital Costs in 2025 amounted to €709 million (€823 million in 2024), decreasing to 1.8% of Group revenues (from 2.2% of Group revenues last year).
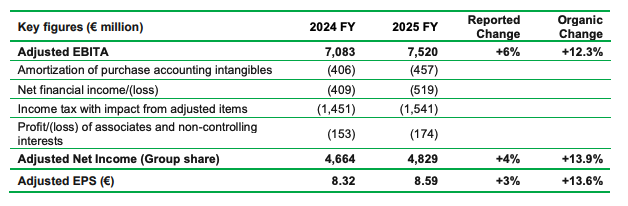
▪ ADJUSTED NET INCOME UP +14% ORGANIC
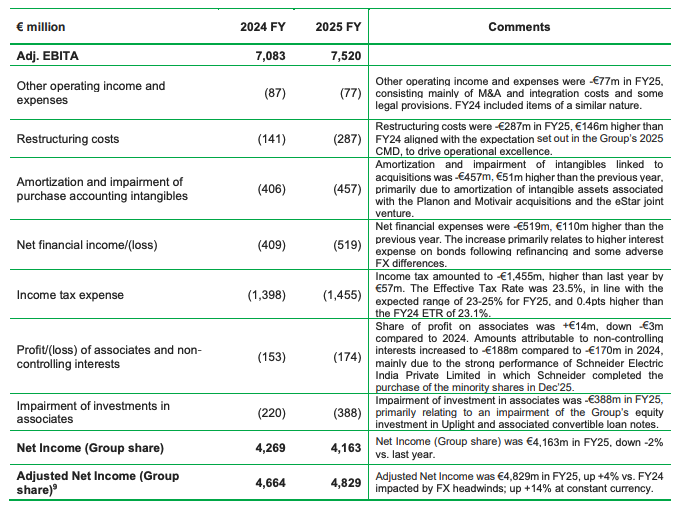
9. See appendix Adjusted Net Income & Adjusted EPS.
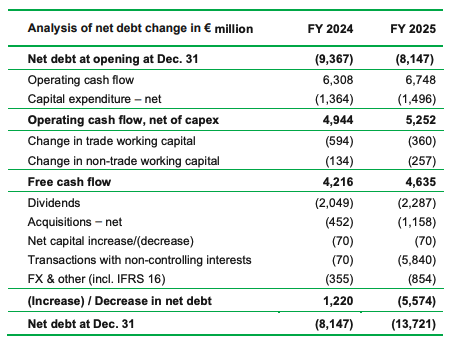
▪ FREE CASH FLOW OF €4.6 BILLION
The Group delivered Free Cash Flow of €4,635 million in FY25.
Operating cash flow was strong at €6,748 million, up +€440 million vs. FY24 primarily due to the strong growth in EBITDA in FY25. The operating cash flow included R&D cash costs of €2,380 million, which remained stable at 5.9% of 2025 revenue.
Net capital expenditure increased to -€1,496 million (€132 million higher than in FY24) representing around 3.7% of revenues, with 2.5% relating to net tangible capex and 1.2% to intangible capex (mainly capitalized development costs), as the Group continues to invest in its global supply chain and focus on innovation.
Trade working capital buildup impacted the free cash flow in 2025 by -€360 million (compared to -€594 million in FY24). DSO improved by 2 days compared to December 2024 due to strong cash collection, while DPO improved by 1 day. DIN improved by 3 days vs. December 2024 supported by structured actions to reduce closing inventories to an appropriate level as part of the Group’s focus on rigorous working capital management.
Non-trade working capital impacted the free cash flow in 2025 by -€257 million (compared to -€134 million in FY24) with the year-on-year variance primarily due to a fine of -€207 million paid in 2025 in relation to a previously disclosed legal case in France, partly offset by lower bonus accruals.
▪ BALANCE SHEET REMAINS STRONG
Schneider Electric’s net debt at December 31, 2025 amounted to €13,721 million (up from €8,147 million at December 31, 2024) after payment of -€2.3 billion to fulfill the 2024 dividend, a net impact from acquisitions and disposals of -€1.2 billion, transactions with non-controlling interests for -€5.8 billion (of which -€5.5 billion relating to the purchase of the remaining minority interests in SEIPL) and payment of -€0.3 billion in relation to share buyback, offset by the strong Free Cash Flow performance of +€4.6 billion.
The Group remains committed to retaining its A-grade credit ratings.
▪ CASH CONVERSION & PROPOSED DIVIDEND
The cash conversion ratio (Free Cash Flow as a percentage of Net Income Group Share) was 111% in FY25, in part due to the non-cash impairment of investment in associates and payment of the fine in France. The cash conversion ratio was 106% adjusted for these items, up from 94% on an equivalent basis last year, demonstrating the Group’s ability to sustainably drive strong cash conversion, including in periods of higher growth.
Aligned with the capital allocation framework set out in the CMD, the Board of Directors proposes a dividend10 of €4.20 per share, up +8% vs. 2024 as the Group maintains its progressive dividend policy for the 16 th year.
IV. SCHNEIDER SUSTAINABILITY IMPACT
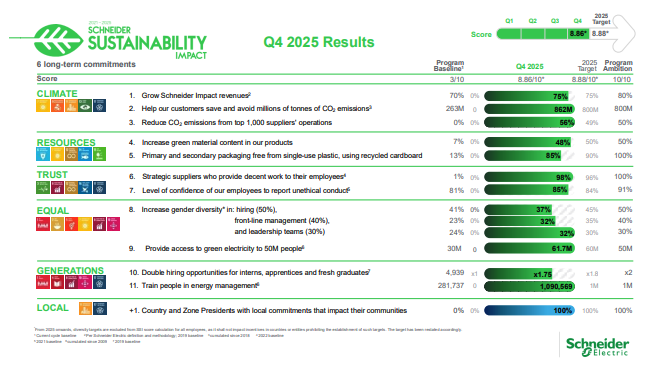
Schneider Electric today published its 2025 extra-financial results, marking the conclusion of its Schneider Sustainability Impact (SSI) 2021–2025 program. Over the past five years, the Group has reported measurable progress across climate, social, and governance dimensions, supporting customers, partners, and communities in their transition toward a more sustainable and inclusive future.
As of the end of Q4 2025, Schneider Sustainability Impact program (SSI) achieved an overall score of 8.86/10, reflecting the scale of the sustainable transformation carried out across the Group and its value chain over the past five years. This chapter demonstrates how Schneider Electric has translated long-term ambition into measurable, global and local results, transforming its business and engaging its ecosystem.
“Schneider Sustainability Impact 2021–2025 has been a transformative journey,” said Olivier Blum, CEO of Schneider Electric. “For more than 20 years, sustainability has been rooted in our identity and driven our journey forward. By combining innovation, partnerships, and accountability, we have delivered progress against key sustainability metrics across our operations and our ecosystem. These results reinforce our belief that sustainability is a powerful driver of both performance and positive impact.”
Schneider Electric has been playing a critical role in helping customers reduce their environmental footprint through its products and solutions. By the end of 2025, the Group enabled customers to save and avoid 862 million tonnes of CO₂ emissions, surpassing its original ambition of 800 Mt CO₂. Moreover, through the Zero Carbon Project, Schneider Electric has successfully mobilized its supply chain to take concrete action toward decarbonization. By engaging its top 1,000 suppliers, the Group contributed to a 56% reduction in suppliers’ operational CO₂ emissions.
Schneider continues to push for fair and safe working conditions across its suppliers’ ecosystem. As of 2025, 98% of strategic suppliers conform to the Group’s Decent Work requirements, reinforcing respect for human rights, ethical labor practices, and employee well-being in its value chain.
Guided by its mission to power progress for all, Schneider Electric has continued to contribute to a fair and inclusive energy transition, enabling its stakeholders to participate in and benefit from sustainable progress. Through the Access to Energy initiative launched in 2009, the Group has expanded access to clean, reliable, and affordable energy for underserved communities, impacting more than 60 million people worldwide by the end of 2025, well beyond its original ambition of 50 million beneficiaries. At the same time, Schneider Electric has invested in youths’ upskilling and education to support long-term inclusion, training over one million people in energy management since 2009, and equipping individuals with the capabilities needed to build resilient communities and support the global energy transition.
Since 2021, more than 500 local sustainability initiatives have come to life in the countries where Schneider Electric operates, illustrating how the Company contributes to generating impact for local communities.
“Closing SSI 2021-2025 is a milestone, not a finish line. What remains is the collective capability we’ve built with our people, customers and suppliers, and the discipline to deliver concrete results and meaningful impact” said Esther Finidori, Chief Sustainability Officer of Schneider Electric. “As we move toward 2030, our compass is clear: we’ll leverage technology and innovation for progress, bring others along, learn and share what works to scale impact while continuously striving to do the right thing. At Schneider Electric, we’re convinced that advancing energy technology can help power progress for all.”
In addition to these achievements, Schneider Electric’s sustainability approach has also been recognized across several top ESG ratings, such as Ecovadis Platinum medal, the placement on CDP’s Climate Change A list, and the ranking 1st in the Social Benchmark and 3rd in the Gender Benchmark in the latest World Benchmarking Alliance (WBA) assessment, among others.
For a detailed view of all indicators and progress, please refer to the full Q4 2025 Schneider Sustainability Impact report, including the latest progress dashboard:
V. PORTFOLIO UPDATE
Acquisition
- As separately announced on December 18, 2025, Schneider Electric has completed the transaction to acquire the remaining 35% of Schneider Electric India Private Limited (“SEIPL”) from Temasek to reach full ownership. This transaction reinforces Schneider Electric’s strategic focus on India as both an attractive domestic growth market and one of the key hubs in its multi-hub strategy.
VI. FINANCING UPDATE
Since reporting on Q3 2025, Schneider Electric has successfully issued bonds to support financing the previously announced acquisition of the remaining 35% stake in Schneider Electric India Private Limited (“SEIPL”).
- On December 3, 2025, the Group successfully issued a €750 million fixed rate bond with a 2.750% coupon maturing in July 2030.
VII. EXPECTED TRENDS IN 2026
- Strong market demand to drive growth, with positive contribution from all four end-markets
- Data Center & Networks to lead growth based on strong demand in 2025; Industry and Infrastructure to accelerate; Buildings to improve contribution, aligned with macroeconomic trends
- Systems to lead growth; Products to show improved contribution with continued recovery in Discrete
- Strong growth in Software and Services, with key focus on driving more recurring revenues
- All four regions to contribute to growth (North America, Europe, China & East Asia, South Asia & International), led by U.S. and India
- The Group expects to be Net Price positive in value (price to offset raw material impact and tariffs), ramping up throughout the year
- The Group expects the other drivers of adj. EBITA margin expansion to be aligned with those set out in its recent Capital Markets Day
VIII. 2026 TARGET
The Group sets its 2026 financial target as follows:
2026 Adjusted EBITA growth of between +10% and +15% organic.
The target would be achieved through a combination of organic revenue growth and margin improvement, currently expected to be:
- Revenue growth of +7% to +10% organic
- Adjusted EBITA margin up +50bps to +80bps organic
This implies Adjusted EBITA margin of around 19.1% to 19.4% (including scope based on transactions completed to-date and FX based on current estimation).
Further notes on 2026 available in appendix
IX. 2026-2030 FINANCIAL TARGETS AS ANNOUNCED IN 2025 CAPITAL MARKETS DAY
Based on its current view and assuming no major changes to the macroeconomic and geopolitical environment, Schneider Electric announced its medium-term financial targets as follows:
2026-30 Financial Targets:
- Organic revenue growth of between +7% to +10%, CAGR 2025-203011
- Organic expansion of Adjusted EBITA margin of +250 basis points, cumulatively, 2026-2030
- Cash conversion ratio12 to be around 100%, 2026-2030
11. 5-year CAGR
12. Free Cash Flow as a proportion of Net Income (Group Share)
The financial statements of the period ending December 31, 2025 were established by the Board of Directors on February 25, 2026. At the date of this press release, the audit procedures were carried out and the report of the statutory auditors is being finalized.
The Q4 2025 & FY 2025 Annual Results presentation is available at www.se.com
Q1 2026 Revenues will be presented on April 30, 2026.
The Annual General Meeting will take place on May 7, 2026.
Disclaimer: All forward-looking statements are Schneider Electric management’s present expectations of future events and are subject to a number of factors and uncertainties that could cause actual results to differ materially from those described in the forward-looking statements. For a detailed description of these factors and uncertainties, please refer to the section “Risk Factors” in our Universal Registration Document (which is available on www.se.com). Schneider Electric undertakes no obligation to publicly update or revise any of these forward-looking statements.
Appendix – Further notes on 2026
- Foreign Exchange impact: Based on current rates13, the FX impact on FY 2026 revenues is estimated to be between -€850 million to -€950 million. The FX impact at current rates on adjusted EBITA margin for FY 2026 could be around -10bps
- Scope impact: Around flat on 2026 revenues and around flat on 2026 adjusted EBITA margin, based on transactions completed to-date
- Tax rate: The ETR is expected to be in a 23-25% range in 2026
- Restructuring: The Group expects cumulative incremental restructuring costs of €500 million in the years 2025-2027, above a normalized rate of c. €100 – €150 million per year
- Finance costs: The Group expects incremental costs of c. -€150 million in 2026 associated with the financing of the transaction to acquire the remaining 35% of SEIPL.
Appendix – Revenues breakdown by business
13. Forward exchange rates are volatile and difficult to predict. Consequently, the impact of such movement and possible impacts from hyperinflation technical accounting (IAS29) are not factored at this stage.
Throughout this document growth percentage calculations are compared to the same period of the prior year, unless stated otherwise.
Appendix – Scope of Consolidation
Appendix – Adjusted EBITA, Analysis of Change
Appendix – Results breakdown by division
Appendix – Adjusted Net Income & Adjusted EPS
Appendix – Free Cash Flow and Net Debt
Appendix – ROCE
SourceSchneider Electric
EMR Analysis
More information on Schneider Electric: See the full profile on EMR Executive Services
More information on Jean-Pascal Tricoire (Chairman of the Board of Directors, Member of the Governance, Nominations & Sustainability Committee, Member of the Investment Committee, Member of the Digital Committee, Schneider Electric): See the full profile on EMR Executive Services
More information on Olivier Blum (Chief Executive Officer, Schneider Electric): See the full profile on EMR Executive Services
More information on Hilary Maxson (Member of the Executive Committee and Executive Vice President, Group Chief Financial Officer, Schneider Electric till April 5, 2026): See the full profile on EMR Executive Services
More information on Nathan Fast (Senior Vice President, Head of Investor Relations, Schneider Electric till April 5, 2026 + Member of the Executive Committee and Executive Vice President, Group Chief Financial Officer, Schneider Electric as from April 6, 2026): See the full profile on EMR Executive Services
More information on Energy Management by Schneider Electric: See the full profile on EMR Executive Services
More information on Frédéric Godémél (Member of the Executive Committee and Executive Vice President, Energy Management, Schneider Electric): See the full profile on EMR Executive Services
More information on Industrial Automation by Schneider Electric: See the full profile on EMR Executive Services
More information on Gwenaelle Avice-Huet (Member of the Executive Committee and Executive Vice President, Industrial Automation, Schneider Electric): See the full profile on EMR Executive Services
More information on AVEVA by Schneider Electric: See the full profile on EMR Executive Services
More information on Caspar Herzberg (Member of the Executive Committee, Chief Executive Officer, AVEVA, Schneider Electric): See the full profile on EMR Executive Services
More information on Operation Technology Inc. (“ETAP”) by Schneider Electric: See the full profile on EMR Executive Services
More information on Tanuj Khandelwal (Chief Executive Officer, ETAP, Schneider Electric): See the full profile on EMR Executive Services
More information on RIB Software by Schneider Electric: See the full profile on EMR Executive Services
More information on René Wolf (Chief Executive Officer, RIB Software, Schneider Electric): See the full profile on EMR Executive Services
More information on Planon by Schneider Electric: See the full profile on EMR Executive Services
More information on Motivair Corporation by Schneider Electric: See the full profile on EMR Executive Services
More information on Rich Whitmore (President & Chief Executive Officer, Motivair Corporation, Schneider Electric): See the full profile on EMR Executive Services
More information on the Schneider Electric Sustainability Strategy, Sustainability Impact (SSI) 2021-2025 Program and 2024 Sustainability Report: See the full profile on EMR Executive Services
More information on Esther Finidori (Member of the Executive Committee and Chief Sustainability Officer, Schneider Electric): See the full profile on EMR Executive Services
More information on the Q4 2025 Sustainability Impact by Schneider Electric: https://cdn.builder.io/o/assets%2F87a13b564d504489a60e78515594f31e%2Fab49f62e01674fbfa24bee5575d8507f?alt=media&token=496936f7-e2a5-4b79-ab48-24cade9a5638&apiKey=87a13b564d504489a60e78515594f31e
More information on the Zero Carbon Project by Schneider Electric: https://www.se.com/ww/en/about-us/sustainability/zero-carbon-project.jsp + The initiative provides capacity building, thought leadership, resources and handholding to program participants and help them set and achieve their carbon reduction targets. The suppliers are encouraged to quantify their carbon emissions, adopt ambitious decarbonization goals and deploy action plan to achieve it.
The Zero Carbon Project cultivates exchange of best practices by a variety of live engagements and training sessions organized on a regular basis. It leverages expert knowledge and experiential learning on decarbonization from Schneider to support suppliers.
- > 1,000 companies joined The Zero Carbon Project
- > 1,300 supplier participants trained in 8 technical trainings on decarbonization
- -50% reduction of supplier operations emissions (scopes 1 and 2) by 2025
More information on Schneider Electric India Private Limited (“SEIPL”) by Schneider Electric: https://www.se.com/in/en/ +
- India is now the third largest market for the Group and one of its four hubs;
- In 2024, SEIPL had statutory revenues of €1.8 billion (including export sales); total sales in India were €2.5 billion across subsidiaries;
- Schneider Electric has adopted a “2 brands 2 sales” strategy post the initial transaction in 2018 with L&T E&A now rebranded as Lauritz Knudsen.
More information on Lauritz Knudsen Electrical and Automation (previously L&T E&A, previously L&T Switchgear) by Schneider Electric India Private Limited (“SEIPL”) by Schneider Electric: https://www.lk-ea.com/ + We are one of the largest electrical players and most trusted brands in India. With a robust manufacturing footprint of 2.1 million sq. ft across 5 factories, 33+ offices, and a pan-India presence across 500+ cities.
Lauritz Knudsen Electrical and Automation is a pioneering electrical and automation brand with a rich legacy of over 70 years in India. We offer comprehensive portfolio of low-voltage switchgear, medium-voltage switchgear, automation solutions, software, and services catering to diverse segments, including homes, agriculture, buildings, infrastructure, and industry.
More information on Deepak Sharma (Zone President Greater India and Managing Director & Chief Executive Officer Schneider Electric Indian (SEIPL), Schneider Electric): See the full profile on EMR Executive Services
More information on Temasek: https://www.temasek.com.sg/en/index + Incorporated in 1974, Temasek is an investment company headquartered in Singapore. Supported by 13 offices across 9 countries, Temasek owns a S$434 billion portfolio as at 31 March 2025, mainly in Singapore and the rest of Asia.
More information on Dilhan Pillay Sandrasegara (Executive Director and Chief Executive Officer, Temasek): https://www.temasek.com.sg/en/about-us/our-leadership + https://www.linkedin.com/in/dilhanpillay
More information on Ernst & Young: http://www.ey.com/ + At EY, our purpose is Building a better working world. The insights and quality services we provide help build trust and confidence in the capital markets and in economies the world over. We develop outstanding leaders who team to deliver on our promises to all our stakeholders. In so doing, we play a critical role in building a better working world for our people, for our clients and for our communities.
In a world that’s changing faster than ever, our purpose acts as our North Star, guiding our 400,000 people — providing the context and meaning for the work we do every day. We help digital pioneers fight data piracy; guide governments through cash-flow crises; unlock new medical treatments with data analytics; and pursue high quality audits to build trust in financial markets and business. And now we’ve unified all our artificial intelligence (AI) innovation and development efforts under one platform, EY.ai, to help enable clients to efficiently access the benefits of AI. It is also intended to increase transparency, trust, and confidence in AI as EY seeks to use these new capabilities to serve the broader interests of society and contribute to a more inclusive future.
Through our four integrated service lines — Assurance, Consulting, Strategy and Transactions, and Tax — and our deep sector knowledge, we help our clients to capitalize on new opportunities and assess and manage risk to deliver responsible growth. Our high-performing, multidisciplinary teams help them fulfill regulatory requirements, keep investors informed and meet stakeholder needs.
More information on Janet Truncale (Global Chairman & Chief Executive Officer, EY): https://www.ey.com/en_gl/about-us#our-people + https://www.linkedin.com/in/janettruncale/
More information on Deloitte: https://www.deloitte.com/global/en.html + Deloitte refers to one or more of Deloitte Touche Tohmatsu Limited (DTTL), its global network of member firms, and their related entities (collectively, the “Deloitte organization”). DTTL (also referred to as “Deloitte Global”) and each of its member firms and related entities are legally separate and independent entities, which cannot obligate or bind each other in respect of third parties. DTTL and each DTTL member firm and related entity is liable only for its own acts and omissions, and not those of each other. DTTL does not provide services to clients.
Deloitte provides leading professional services to nearly 90% of the Fortune Global 500® and thousands of private companies. Our people deliver measurable and lasting results that help reinforce public trust in capital markets and enable clients to transform and thrive. Building on its 180-year history, Deloitte spans more than 150 countries and territories. Learn how Deloitte’s approximately 460,000 people worldwide make an impact that matters.
More information on Joe Ucuzoglu (Global Chief Executive Officer, Deloitte): https://www.deloitte.com/global/en/about/story/facts-and-figures/deloitte-global-board-of-directors.html?icid=top_deloitte-global-board-of-directors + https://www.linkedin.com/in/joseph-ucuzoglu-371b0a11/
More information on EcoVadis: https://ecovadis.com + The World’s Most Trusted Business Sustainability Ratings.
Since its founding in 2007, EcoVadis has grown to become the world’s largest and most trusted provider of business sustainability ratings, creating a global network of more than 150,000+ rated companies.
Our team is composed of over 1900 highly-talented professionals from 80 nationalities.
The EcoVadis sustainability assessment methodology is at the heart of our Ratings and Scorecards and is an evaluation of how well a company has integrated the principles of Sustainability/CSR into their business and management system.
The EcoVadis sustainability assessment methodology is at the heart of our Ratings and Scorecards and is an evaluation of how well a company has integrated the principles of Sustainability/CSR into their business and management system.
Our methodology is built on international sustainability standards, including the Global Reporting Initiative, the United Nations Global Compact, and the ISO 26000, covering 250+ spend categories and 185+ countries. The Sustainability Scorecard illustrates performance across 21 indicators in four themes: Environment, Labor & Human Rights, Ethics and Sustainable Procurement.
EcoVadis medals are awarded to the top 35% of companies assessed by EcoVadis:
Medals are awarded based on the percentile rank of a company which is calculated at the time of scorecard publication. It compares a company’s performance with all rated companies in our database over the previous 12 months. The percentile rank is calculated across all companies in all industries, not per industry.
- Platinum – Top 1% (99+ percentile)
- Gold – Top 5% (95+ percentile)
- Silver – Top 15% (85+ percentile)
- Bronze – Top 35% (65+ percentile)
To be eligible for a medal, a company must achieve a minimum score of 30 in each of the four themes:
- Environment
- Ethics
- Labor & Human Rights
- Sustainable Procurement
More information on Pierre-François Thaler (Co-Founder & Co-Chief Executive Officer, EcoVadis + Co-Founder & Co-Chief Executive Officer, CyberVadis): https://ecovadis.com/leadership/ + https://www.linkedin.com/in/pfthaler/
More information on Frédéric Trinel (Co-Founder & Co-Chief Executive Officer, EcoVadis): https://ecovadis.com/leadership/
More information on the Carbon Disclosure Project (CDP): https://www.cdp.net/en + CDP is a global non-profit that runs the world’s only independent environmental disclosure system for companies, capital markets, cities, states and regions to manage their environmental impacts.
Founded in 2000, CDP was the first organization to leverage investor pressure to influence corporate disclosure on environmental impact. Now with the world’s largest, most comprehensive dataset on environmental action, the insights that CDP holds empower investors, companies, cities, and national and regional governments to make Earth-positive decisions.
As the founder of environmental reporting, we believe in transparency and the power of data to drive change. Partnering with leaders in enterprise, capital, policy and science, we surface the information needed to enable Earth-positive decisions.
We helped more than 22,100 companies and almost 1,000 cities, states and regions disclose their environmental impacts in 2024. Financial institutions with more than a quarter of the world’s institutional assets use CDP data to help inform investment and lending decisions. Aligned with the ISSB’s climate standard, IFRS S2, as its foundational baseline, CDP integrates best-practice reporting standards and frameworks in one place. Our team is truly global, united by our shared desire to build a world where people, planet and profit are truly balanced
Disclosers are evaluated across four scoring levels, representing stages of environmental maturity:
- Disclosure (D/D–): Measures the completeness of a company’s reporting. The number of points allocated to each question depends on both the amount of data requested and their relative importance to data users.
- Awareness (C/C–): Reflects the understanding of how environmental issues relate to the company’s activities and impacts. This level indicates awareness but not yet action.
- Management (B/B–): Recognizes evidence of action and processes to manage environmental issues, showing that the company is moving from understanding to implementation.
- Leadership (A/A–): Represents best practice performance, where the Discloser demonstrates environmental leadership through ambitious strategies, verified progress, and sector-leading action.
More information on Paul Dickinson (Founder Chair, Carbon Disclosure Project (CDP) + Co-Founder, Transition Value Partners (TVP)): https://www.transition-value.com/about + https://www.linkedin.com/in/paul-dickinson-0093a8/
More information on Sherry Madera (Chief Executive Officer, Carbon Disclosure Project (CDP)): https://www.cdp.net/en/about/team + https://www.linkedin.com/in/sherrymadera/
More information on World Benchmarking Alliance (WBA): https://www.worldbenchmarkingalliance.org/ + The World Benchmarking Alliance (WBA) was launched in 2018 because we believed that there needs to be real change in the way that business impact is measured to stimulate action for a sustainable future for everyone.
WBA identified seven transformations that need to take place to put society and the worldwide economy on a more sustainable path to achieve the SDGs. To turn these transformations into action, WBA develops in close collaboration with the Alliance a series of benchmarks assessing 2,000 of the world’s most influential companies, ranking and holding them accountable on their contributions to a sustainable future for people and the planet.
More information on Gerbrand Haverkamp (Executive Director, World Benchmarking Alliance (WBA)): https://www.worldbenchmarkingalliance.org/governance/ + https://www.linkedin.com/in/gerbrandhaverkamp/
EMR Additional Financial Notes:
- Major financial KPI’s since 2017 are available on EMR Executive Services under “Financial Results” and comparison with peers under “Market Positioning”
- Companies’ full profile on EMR Executive Services are based on their official press releases, quarterly financial reports, annual reports and other official documents like the Universal Registration Document.
- All members of the Executive Committee and of the Board have their full profile on EMR Executive Services
- The Schneider Electric Full Year 2025 Results Presentation can be found here: https://cdn.builder.io/o/assets%2F87a13b564d504489a60e78515594f31e%2F7b1392bb0421417abd4c8b6a96f0e6d0?alt=media&token=7d64e2f4-1ad8-4b92-b960-8093644b4f7b&apiKey=87a13b564d504489a60e78515594f31e
- The Schneider 2023-2025 Financial Information Presentation can be found here: https://cdn.builder.io/o/assets%2F87a13b564d504489a60e78515594f31e%2Fa43818ab3d634a9099cc0e1f76a0fa0e?alt=media&token=16c2ae5e-e6da-4960-852c-0247b8c7db7c&apiKey=87a13b564d504489a60e78515594f31e
- The Schneider Electric Full Year 2025 Consolidated Financial Statements can be found here: https://cdn.builder.io/o/assets%2F87a13b564d504489a60e78515594f31e%2F944edc3a70cf48928d925433c41c8109?alt=media&token=29980528-77b4-43d6-9a46-d69f8609e864&apiKey=87a13b564d504489a60e78515594f31e
- The Schneider Electric Q4 2025 Sustainability Impact Presentation can be found here: https://cdn.builder.io/o/assets%2F87a13b564d504489a60e78515594f31e%2Fab49f62e01674fbfa24bee5575d8507f?alt=media&token=496936f7-e2a5-4b79-ab48-24cade9a5638&apiKey=87a13b564d504489a60e78515594f31e
- The Schneider Electric 2024 Universal Registration Document can be found here: https://www.se.com/ww/en/assets/564/document/510443/2024-universal-registration-document.pdf
- The Schneider Electric Full Year 2024 Results Presentation can be found here: https://www.se.com/ww/en/assets/564/document/505718/presentation-fy-results-2024.pdf
- The Schneider Electric Full Year 2024 Financial Report can be found here: https://www.se.com/ww/en/assets/564/document/505720/accounts-fy-results-2024.pdf
- The Schneider Electric Full Year 2024 Sustainability Impact Presentation can be found here: https://www.se.com/ww/en/assets/564/document/505452/schneider-sustainability-impact-q4-2024-results.pdf
- The Schneider Electric 2023 Universal Registration Document can be found here: https://www.se.com/ww/en/assets/564/document/462018/2023-universal-registration-document.pdf
- The Schneider Electric Full Year 2023 Results Presentation can be found here: https://www.se.com/ww/en/assets/564/document/453166/presentation-fy-results-2023.pdf
- The Schneider Electric Full Year 2023 Annual Financial Report can be found here: https://www.se.com/ww/en/assets/564/document/453167/accounts-fy-results-2023.pdf
- The Schneider Electric Strategic Presentation of Peter Herweck during the Capital Market Days 2023 can be found here: https://www.se.com/ww/en/Images/cmd-2023-strategy-presentation_tcm564-441711.pdf
- More information on the Schneider Electric Sustainability Strategy: https://www.se.com/ww/en/about-us/sustainability/
- More information on the Schneider Electric Full Year 2023 Sustainability Impact Presentation can be found here: https://www.se.com/ww/en/assets/564/document/453359/schneider-sustainability-impact-q4-2023-results.pdf
- More information on the Schneider Electric Sustainability Impact 2021-2025 Program: https://download.schneider-electric.com/files?p_Doc_Ref=SSI_2021_25
- The Schneider Electric 2022 Universal Registration Document can be found here: https://flipbook.se.com/catalog/ww/en/41123-Schneider-Annual-Report-2022-EN/#page/1