ABB – ABB Capital Markets Day 2025


- New structure’s clear focus on electrification and automation reflected with three business areas building on shared sales and technology opportunities
- Upgraded Operational EBITA margin target to 18-22 percent with newly introduced targets per business area; ROCE target raised to >20 percent
- Organic and acquired revenue growth targets confirmed; continued focus on bolt-on deals can be complemented by larger transactions; free cash flow conversion to net income target updated to >95 percent to reflect expected strong growth
- Future progress fueled by positioning at the heart of key megatrends and ongoing focus on productivity and efficiency, driven by ABB Way further deployed in the organization
ABB is hosting its Capital Markets Day today at its state-of-the art Motion campus in New Berlin (WI), United States. At the event, CEO Morten Wierod, CFO Timo Ihamuotila, as well as the Presidents of ABB’s three business areas will give an update on achievements so far and on the forward journey, including how ABB helps customers benefit from the increasing role of electricity, energy efficiency and security, decarbonization of industry and advance automation for smarter, more efficient operations.
Morten Wierod said: “ABB is well positioned at the center of robust markets helping our customers optimize, electrify and decarbonize across the power, industry, transport and building segments. These structurally growing end markets with long term secular drivers are underpinning our organic growth ambition.
“We have delivered on our promises and turned ABB into a high performing company. We have achieved this through a sharp focus on our ABB Way decentralized operating model, active portfolio management and strong market exposure. That said, I am very confident we can do even better as we build on the ABB Way and our leadership positions in electrification and automation: The best is yet to come for ABB.”
Updated financial targets: Higher margin and ROCE ambitions
ABB has reached new all-time highs for operational performance (based on Q3 2025 LTM*). Against this backdrop, the company is updating its financial targets based on its new structure with three business areas and excluding its to be divested Robotics division.
The company’s comparable revenue growth target of 5-7 percent and the ambition to add 1-2 percent of revenues in acquired growth are confirmed, both as the average through the economic cycle. Bolt-on acquisitions will be further embedded as part of the ABB Way performance culture with a focus on small to mid-size deals on a continuous basis while larger deals would come on top of the normal deal flow. Strategic fit and value creation remain at the core of inorganic growth ambitions as all transactions need to be in line with the company’s purpose and its operating model, support its growth and profitability ambitions, while allowing ABB to maintain a strong investment grade rating.
At the same time, ABB is increasing the target range for its annual Operational EBITA margin to 18-22 percent (from 16-19 percent) since all business areas are now operating on sustainably higher levels of profitability than in the past. ABB is also introducing specific Operational EBITA margin target ranges for its business areas of Electrification (22-26 percent), Motion (18-22 percent) and Automation (14-18 percent, previously Process Automation business area). The company’s objective for basic EPS growth through the economic cycle of at least high single-digit remains unchanged.
In addition, ABB’s annual ROCE target is being upgraded to >20 percent (>18 percent previously) and ABB is now aiming for >95 percent free cash flow conversion to net income (~100 percent previously) to reflect the expected strong growth.
Sustainability will continue to be at the heart of ABB and its technologies to support the decarbonization of industries, with the company making good progress towards its targets. ABB’s sustainability agenda and the targets remain unchanged and are fully embedded at division level. Together with financial targets they are integrated into the long-term planning and commitment process.
Committed to a strong investment grade rating
Timo Ihamuotila said: “Our upgraded financial targets are driven bottom-up with commitment from our business leaders to drive growth and continuous improvements based on our strategic mandates of stability, profitability and growth that we have now embedded even further into our organization. To me, the strong gross margin improvement over the last years is a testament to the high-quality company ABB is today. But we will not stop here: we will remain laser-focused on investing where it matters and on gross profit productivity.”
ABB reiterates its capital allocation principles: The company will continue to prioritize organic investments. This includes investments in R&D aiming towards 4.5 to 5.0 percent of revenues, including pursuing its embedded software strategy by combining hardware with software to add value for customers; as well as maintaining a high Capex spend to remain a market leader based on its established local-for-local strategy. Additionally, ABB aims at paying a rising sustainable dividend per share over time; executing value-creating acquisitions; and when applicable returning additional cash to shareholders through share buybacks.
Well positioned at the heart of key mega trends
With its reshaped portfolio following the announced divestment of its Robotics division, ABB will offer a stand-out value proposition of its combined electrification and automation portfolio based on three business areas that build on shared sales and technology opportunities. The company has a diverse footprint with all sectors in which it operates expected to require electrification and automation technologies.
The world requires electricity expansion, efficiency, and transition to meet rising power demand and support a sustainable future. The expansion of electricity and grid upgrades are key to energy resilience and ensure that the world has enough power available for growing populations and industries. Energy efficiency helps optimize the use of electricity already accessible as well as reducing waste and costs. The energy transition enables energy systems to shift towards cleaner, renewable sources to address climate change. Increased automation of industries, transport and infrastructure will allow ABB to build on its leadership positions delivering end-to-end integration across key segments to enable more productive, efficient and sustainable operations.
Note to editors: The Capital Markets Day can be followed live on the ABB Investor Relations website from 9am CST / 4pm CET today via the following link: https://capitalmarketsday.abb.com/
*LTM: Last twelve months
Important notice about forward-looking information
This press release includes forward-looking information and statements that are based on current expectations, estimates and projections These expectations, estimates and projections are generally identifiable by statements containing words such as “expects,” “believes,” “estimates,” or similar expressions. However, there are many risks and uncertainties, many of which are beyond our control, that could affect our ability to achieve any particular goal, target, or objective. Although ABB Ltd believes that its expectations reflected in any such forward-looking statement are based upon reasonable assumptions, it can give no assurance that those expectations or any particular goal, objective or result will be achieved.
SourceABB
EMR Analysis
More information on ABB: See full profile on EMR Executive Services
More information on Morten Wierod (Chief Executive Officer and Member of the Group Executive Committee, ABB): See full profile on EMR Executive Services
More information on Timo Ihamuotila (Chief Financial Officer, ABB till end of 2026 + Member of the Executive Committee, ABB till February 1, 2026): See full profile on EMR Executive Services
More information on Christian Nilsson (Chief Financial Officer, Electrification Business Area, ABB till February 1, 2026 + Chief Financial Officer and Member of the Executive Committee, ABB as from February 1, 2026): See full profile on EMR Executive Services
More information on the ABB Way: See full profile on EMR Executive Services
More information on the Sustainability Strategy and Sustainability Statement 2024 by ABB: See full profile on EMR Executive Services
More information on Karin Lepasoon (Chief Communications and Sustainability Officer and Member of Executive Committee, ABB): See full profile on EMR Executive Services
More information on Electrification Business Area by ABB: See the full profile on EMR Executive Services
More information on Giampiero Frisio (President, Electrification Business Area and Member of the Executive Committee, ABB): See full profile on EMR Executive Services
More information on Motion Business Area by ABB: See the full profile on EMR Executive Services
More information on Brandon Spencer (President, Motion Business Area and Member of the Executive Committee, ABB): See full profile on EMR Executive Services
More information on Process Automation Business Area by ABB: See the full profile on EMR Executive Services
More information on Peter Terwiesch (President, Process Automation Business Area and Member of the Executive Committee, ABB): See full profile on EMR Executive Services
More information on Robotics & Discrete Automation Business Area by ABB (Robotics Division to be divested to SoftBank Group subject to regulatory approvals and further customary closing conditions and expected to close in mid-to-late 2026 + Machine Automation Division, which together with ABB Robotics currently forms the Robotics & Discrete Automation Business Area, to become a part of the Process Automation Business Area as of the fourth quarter 2025): See full profile on EMR Executive Services
More information on Sami Atiya (President, Robotics & Discrete Automation Business Area and Member of the Executive Committee, ABB till end of 2025 + Strategic Advisor, ABB from January 2026 till December 2026): See full profile on EMR Executive Services
EMR Additional Notes:
- EBIT:
- Earnings Before Interest and Taxes (EBIT) is a measure of a company’s operating profitability before accounting for interest expenses and income taxes. It is also known as operating profit and shows how effectively a company’s core business is generating profit from its operations.
- EBITA:
- Earnings before interest, taxes, and amortization (EBITA) is a measure of company profitability used by investors. It is helpful for comparing one company to another in the same line of business.
- EBITA = Net income + Interest + Taxes + Amortization
- EBITDA:
- Earnings before interest, taxes, depreciation, and amortization (EBITDA) is an alternate measure of profitability to net income. By including depreciation and amortization as well as taxes and debt payment costs, EBITDA attempts to represent the cash profit generated by the company’s operations.
- EBITDA and EBITA are both measures of profitability. The difference is that EBITDA also excludes depreciation.
- EBITDA is the more commonly used measure because it adds depreciation—the accounting practice of recording the reduced value of a company’s tangible assets over time—to the list of factors.
- EV/EBITDA (Enterprise Multiple):
- Enterprise multiple, also known as the EV-to-EBITDA multiple, is a ratio used to determine the value of a company.
- It is computed by dividing enterprise value by EBITDA.
- The enterprise multiple takes into account a company’s debt and cash levels in addition to its stock price and relates that value to the firm’s cash profitability.
- Enterprise multiples can vary depending on the industry.
- Higher enterprise multiples are expected in high-growth industries and lower multiples in industries with slow growth.
- ROCE:
- The term return on capital employed (ROCE) refers to a financial ratio that can be used to assess a company’s profitability and capital efficiency. In other words, this ratio can help to understand how well a company is generating profits from its capital as it is put to use.
- Financial ratio that is used to measure the profitability of a company and the efficiency with which it uses its capital. Put simply, it measures how good a business is at generating profits from capital.
- ROCE = EBIT / Capital Employed (Total Equity + Total Debt).
- Free Cash Flow (FCF):
- Free cash flow (FCF) is a company’s available cash repaid to creditors and as dividends and interest to investors. Management and investors use free cash flow as a measure of a company’s financial health. FCF reconciles net income by adjusting for non-cash expenses, changes in working capital, and capital expenditures. Free cash flow can reveal problems in the financial fundamentals before they become apparent on a company’s income statement. A positive free cash flow doesn’t always indicate a strong stock trend. FCF is money that is on hand and free to use to settle liabilities or obligations.
- Carbon Dioxide (CO2):
- The primary greenhouse gas emitted through human activities. Carbon dioxide enters the atmosphere through burning fossil fuels (coal, natural gas, and oil), solid waste, trees and other biological materials, and also as a result of certain chemical reactions (e.g., manufacture of cement). Carbon dioxide is removed from the atmosphere (or “sequestered”) when it is absorbed by plants as part of the biological carbon cycle.
- Biogenic Carbon Dioxide (CO2):
- Biogenic Carbon Dioxide (CO2) and Carbon Dioxide (CO2) are the same molecule. Scientists differentiate between biogenic carbon (that which is absorbed, stored and emitted by organic matter like soil, trees, plants and grasses) and non-biogenic carbon (that found in all other sources, most notably in fossil fuels like oil, coal and gas).
- CO2e (Carbon Dioxide Equivalent):
- CO2e means “carbon dioxide equivalent”. In layman’s terms, CO2e is a measurement of the total greenhouse gases emitted, expressed in terms of the equivalent measurement of carbon dioxide. On the other hand, CO2 only measures carbon emissions and does not account for any other greenhouse gases.
- A carbon dioxide equivalent or CO2 equivalent, abbreviated as CO2-eq is a metric measure used to compare the emissions from various greenhouse gases on the basis of their global-warming potential (GWP), by converting amounts of other gases to the equivalent amount of carbon dioxide with the same global warming potential.
- Carbon dioxide equivalents are commonly expressed as million metric tonnes of carbon dioxide equivalents, abbreviated as MMTCDE.
- The carbon dioxide equivalent for a gas is derived by multiplying the tonnes of the gas by the associated GWP: MMTCDE = (million metric tonnes of a gas) * (GWP of the gas).
- For example, the GWP for methane is 25 and for nitrous oxide 298. This means that emissions of 1 million metric tonnes of methane and nitrous oxide respectively is equivalent to emissions of 25 and 298 million metric tonnes of carbon dioxide.
- Carbon Footprint:
- There is no universally agreed definition of what a carbon footprint is.
- A carbon footprint is generally understood to be the total amount of greenhouse gas (GHG) emissions that are directly or indirectly caused by an individual, organization, product, or service. These emissions are typically measured in tonnes of carbon dioxide equivalent (CO2e).
- In 2009, the Greenhouse Gas Protocol (GHG Protocol) published a standard for calculating and reporting corporate carbon footprints. This standard is widely accepted by businesses and other organizations around the world. The GHG Protocol defines a carbon footprint as “the total set of greenhouse gas emissions caused by an organization, directly and indirectly, through its own operations and the value chain.”
- Decarbonization:
- Reduction of carbon dioxide emissions through the use of low carbon power sources, and achieving a lower output of greenhouse gases into the atmosphere.
- Carbon Credits or Carbon Offsets:
- Permits that allow the owner to emit a certain amount of carbon dioxide or other greenhouse gases. One credit permits the emission of one ton of carbon dioxide or the equivalent in other greenhouse gases.
- The carbon credit is half of a so-called cap-and-trade program. Companies that pollute are awarded credits that allow them to continue to pollute up to a certain limit, which is reduced periodically. Meanwhile, the company may sell any unneeded credits to another company that needs them. Private companies are thus doubly incentivized to reduce greenhouse emissions. First, they must spend money on extra credits if their emissions exceed the cap. Second, they can make money by reducing their emissions and selling their excess allowances.
- Carbon Capture and Storage (CCS) – Carbon Capture, Utilisation and Storage (CCUS):
- CCS involves the capture of carbon dioxide (CO2) emissions from industrial processes. This carbon is then transported from where it was produced, via ship or in a pipeline, and stored deep underground in geological formations.
- CCS projects typically target 90 percent efficiency, meaning that 90 percent of the carbon dioxide from the power plant will be captured and stored.
- CCUS adds the utilization aspect, where the captured CO2 is used as a new product or raw material.
- Carbon Dioxide Removal (CDR) or Durable Carbon Removal:
- Carbon Dioxide Removal encompasses approaches and methods for removing CO2 from the atmosphere and then storing it permanently in underground geological formations, in biomass, oceanic reservoirs or long-lived products in order to achieve negative emissions.
- Direct Air Capture (DAC):
- Technologies that extract CO2 directly from the atmosphere at any location, unlike carbon capture which is generally carried out at the point of emissions, such as a steel plant.
- Constraints like costs and energy requirements as well as the potential for pollution make DAC a less desirable option for CO2 reduction. Its larger land footprint when compared to other mitigation strategies like carbon capture and storage systems (CCS) also put it at a disadvantage.
- Direct Air Capture and Storage (DACCS):
- Climate technology that removes carbon dioxide (CO2) directly from the ambient atmosphere using large fans and chemical processes to bind with the CO2.
- Bioenergy with Carbon Capture and Storage (BECCS):
- Negative emissions technology that captures carbon dioxide (CO2) from biomass used for energy production and stores it permanently. Plants absorb CO2 from the atmosphere as they grow (photosynthesis), and BECCS interrupts the cycle by capturing this biogenic CO2 during the energy conversion process—burning, fermentation, etc.—instead of letting it re-enter the atmosphere.
- Enhanced Rock Weathering (ERW):
- Carbon dioxide removal (CDR) technique that accelerates the natural process of rock weathering by grinding silicate rocks into dust and spreading it on land, typically agricultural fields. This process uses rainwater to convert atmospheric carbon dioxide into mineral carbonates, which are then stored long-term in soils, groundwater, and oceans.
- Limits of Carbon Dioxide Storage:
- Carbon storage is not endless; the Earth’s capacity for permanently storing vast amounts of captured carbon, particularly in geological formations, is limited, potentially reaching a critical limit of 1,460 gigatonnes at around 2200, though storage durations vary significantly depending on the method, from decades for some biological methods to potentially millions of years for others like mineralization. While some methods offer very long-term storage, the sheer volume needed to meet climate targets requires scaling up storage significantly beyond current capacity, raising concerns about the available volume over time.
- Global Warming:
- Global warming is the long-term heating of Earth’s climate system observed since the pre-industrial period (between 1850 and 1900) due to human activities, primarily fossil fuel burning, which increases heat-trapping greenhouse gas levels in Earth’s atmosphere.
- Global Warming Potential (GWP):
- The heat absorbed by any greenhouse gas in the atmosphere, as a multiple of the heat that would be absorbed by the same mass of carbon dioxide (CO2). GWP is 1 for CO2. For other gases it depends on the gas and the time frame.
- Carbon dioxide equivalent (CO2e or CO2eq or CO2-e) is calculated from GWP. For any gas, it is the mass of CO2 which would warm the earth as much as the mass of that gas. Thus it provides a common scale for measuring the climate effects of different gases. It is calculated as GWP times mass of the other gas. For example, if a gas has GWP of 100, two tonnes of the gas have CO2e of 200 tonnes.
- GWP was developed to allow comparisons of the global warming impacts of different gases.
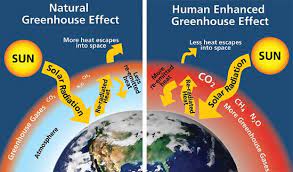
- Greenhouse Gas (GHG):
- A greenhouse gas is any gaseous compound in the atmosphere that is capable of absorbing infrared radiation, thereby trapping and holding heat in the atmosphere. By increasing the heat in the atmosphere, greenhouse gases are responsible for the greenhouse effect, which ultimately leads to global warming.
- The main gases responsible for the greenhouse effect include carbon dioxide, methane, nitrous oxide, and water vapor (which all occur naturally), and fluorinated gases (which are synthetic).
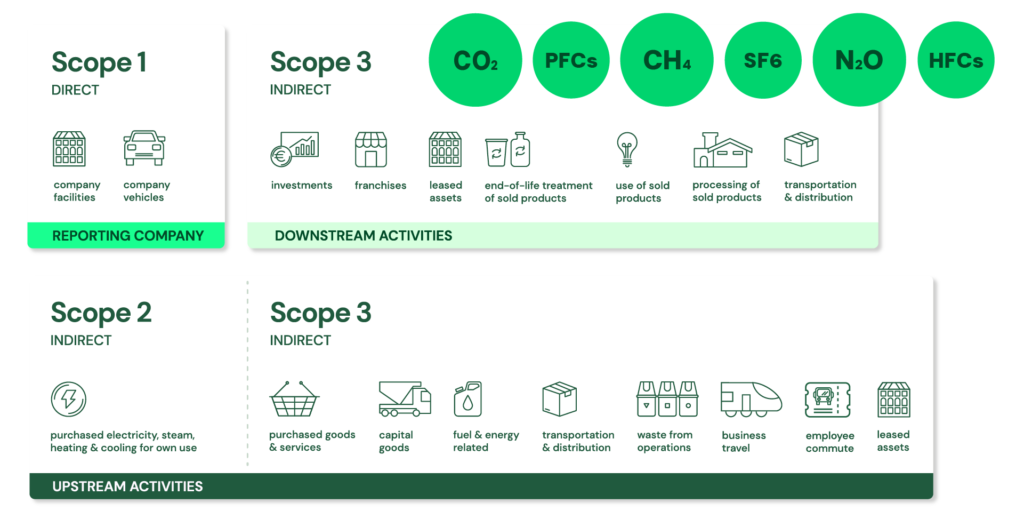
- GHG Protocol Corporate Standard Scope 1, 2 and 3: https://ghgprotocol.org/ + The GHG Protocol Corporate Accounting and Reporting Standard provides requirements and guidance for companies and other organizations preparing a corporate-level GHG emissions inventory. Scope 1 and 2 are typically mandatory for companies that are required to report their emissions by national or regional regulations. The GHG Protocol itself is a voluntary standard.
- Scope 1: Direct emissions:
- Direct emissions from company-owned and controlled resources. In other words, emissions are released into the atmosphere as a direct result of a set of activities, at a firm level. It is divided into four categories:
- Stationary combustion (e.g from fuels, heating sources). All fuels that produce GHG emissions must be included in scope 1.
- Mobile combustion is all vehicles owned or controlled by a firm, burning fuel (e.g. cars, vans, trucks). The increasing use of “electric” vehicles (EVs), means that some of the organisation’s fleets could fall into Scope 2 emissions.
- Fugitive emissions are leaks from greenhouse gases (e.g. refrigeration, air conditioning units). It is important to note that refrigerant gases are a thousand times more dangerous than CO2 emissions. Companies are encouraged to report these emissions.
- Process emissions are released during industrial processes, and on-site manufacturing (e.g. production of CO2 during cement manufacturing, factory fumes, chemicals).
- Direct emissions from company-owned and controlled resources. In other words, emissions are released into the atmosphere as a direct result of a set of activities, at a firm level. It is divided into four categories:
- Scope 2: Indirect emissions – owned:
- Indirect emissions from the generation of purchased energy, from a utility provider. In other words, all GHG emissions released in the atmosphere, from the consumption of purchased electricity, steam, heat and cooling. For most organisations, electricity will be the unique source of scope 2 emissions. Simply stated, the energy consumed falls into two scopes: Scope 2 covers the electricity consumed by the end-user. Scope 3 covers the energy used by the utilities during transmission and distribution (T&D losses).
- Scope 3: Indirect emissions – not owned:
- Indirect emissions – not included in scope 2 – that occur in the value chain of the reporting company, including both upstream and downstream emissions. In other words, emissions are linked to the company’s operations. According to the GHG protocol, scope 3 emissions are separated into 15 categories.
- Scope 1: Direct emissions:
- Earning Per Share (EPS):
- Company’s net income subtracted by preferred dividends and then divided by the average number of common shares outstanding. The resulting number serves as an indicator of a company’s profitability. It is common for a company to report EPS that is adjusted for extraordinary items and potential share dilution.
- The higher a company’s EPS, the more profitable it is considered to be.
- Earnings per share value is calculated as net income (also known as profits or earnings) divided by available shares. A more refined calculation adjusts the numerator and denominator for shares that could be created through options, convertible debt, or warrants. The numerator of the equation is also more relevant if it is adjusted for continuing operations.
- Earning Per Share (EPS) per Purchase Price Allocation (PPA):
- PPA (Purchase Price Allocation) happens after a company acquires another — it’s the accounting process of allocating the purchase price of the acquired business to its identifiable assets and liabilities (like revaluing assets, recognizing goodwill, etc.).
- EPS pre PPA means the company’s earnings per share calculated before taking into account the accounting effects of purchase price allocation from acquisitions.
- In other words, it’s a “clean” or adjusted EPS showing the company’s underlying profitability without acquisition-related accounting distortions (like amortization of intangible assets or revaluation effects).
- Hardware vs. Software vs. Firmware:
- Hardware is physical: It’s “real,” sometimes breaks, and eventually wears out.
- Since hardware is part of the “real” world, it all eventually wears out. Being a physical thing, it’s also possible to break it, drown it, overheat it, and otherwise expose it to the elements.
- Here are some examples of hardware:
- Smartphone
- Tablet
- Laptop
- Desktop computer
- Printer
- Flash drive
- Router
- Software is virtual: It can be copied, changed, and destroyed.
- Software is everything about your computer that isn’t hardware.
- Here are some examples of software:
- Operating systems like Windows 11 or iOS
- Web browsers
- Antivirus tools
- Adobe Photoshop
- Mobile apps
- Firmware is virtual: It’s software specifically designed for a piece of hardware
- While not as common a term as hardware or software, firmware is everywhere—on your smartphone, your PC’s motherboard, your camera, your headphones, and even your TV remote control.
- Firmware is just a special kind of software that serves a very narrow purpose for a piece of hardware. While you might install and uninstall software on your computer or smartphone on a regular basis, you might only rarely, if ever, update the firmware on a device, and you’d probably only do so if asked by the manufacturer, probably to fix a problem.
- Hardware is physical: It’s “real,” sometimes breaks, and eventually wears out.
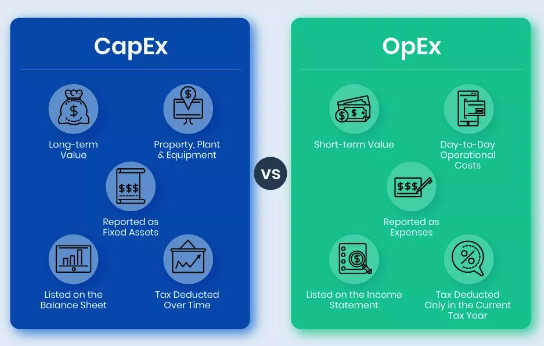
- CapEx vs. OpEx:
- Capital expenditures (CapEx) are a company’s major, long-term expenses while operating expenses (OpEx) are a company’s day-to-day expenses.
- Examples of CapEx include physical assets, such as buildings, equipment, machinery, and vehicles. Examples of OpEx include employee salaries, rent, utilities, and property taxes.
- Grid, Microgrids, DERs and DERM’s:
- Grid / Power Grid:
- The power grid is a network for delivering electricity to consumers. The power grid includes generator stations, transmission lines and towers, and individual consumer distribution lines.
- The grid constantly balances the supply and demand for the energy that powers everything from industry to household appliances.
- Electric grids perform three major functions: power generation, transmission, and distribution.
- The power grid is a network for delivering electricity to consumers. The power grid includes generator stations, transmission lines and towers, and individual consumer distribution lines.
- Microgrid:
- Small-scale power grid that can operate independently or collaboratively with other small power grids. The practice of using microgrids is known as distributed, dispersed, decentralized, district or embedded energy production.
- Smart Grid:
- Any electrical grid + IT at all levels.
- Micro Grid:
- Group of interconnected loads and DERs (Distributed Energy Resources) within a clearly defined electrical and geographical boundaries witch acts as a single controllable entity with respect to the main grid.
- Distributed Energy Resources (DERs):
- Small-scale electricity supply (typically in the range of 3 kW to 50 MW) or demand resources that are interconnected to the electric grid. They are power generation resources and are usually located close to load centers, and can be used individually or in aggregate to provide value to the grid.
- Common examples of DERs include rooftop solar PV units, natural gas turbines, microturbines, wind turbines, biomass generators, fuel cells, tri-generation units, battery storage, electric vehicles (EV) and EV chargers, and demand response applications.
- Small-scale electricity supply (typically in the range of 3 kW to 50 MW) or demand resources that are interconnected to the electric grid. They are power generation resources and are usually located close to load centers, and can be used individually or in aggregate to provide value to the grid.
- Distributed Energy Resources Management Systems (DERMS):
- Platforms which helps mostly distribution system operators (DSO) manage their grids that are mainly based on distributed energy resources (DER).
- DERMS are used by utilities and other energy companies to aggregate a large energy load for participation in the demand response market. DERMS can be defined in many ways, depending on the use case and underlying energy asset.
- Platforms which helps mostly distribution system operators (DSO) manage their grids that are mainly based on distributed energy resources (DER).
- Grid / Power Grid:
EMR Additional Financial Notes:
- Major financial KPI’s since 2017 are available on EMR Executive Services under “Financial Results” and comparison with peers under “Market Positioning”
- Companies’ full profile on EMR Executive Services are based on their official press releases, quarterly financial reports, annual reports and other official documents.
- All members of the Executive Committee and of the Board have their full profile on EMR Executive Services
- The ABB Q3 2025 Results Presentation can be found here: https://library.e.abb.com/public/21008831e120458797f5b71896bfb98c/ABB-Q3-2025-press-release-English.pdf
- The ABB Q3 2025 Financial Information can be found here: https://library.e.abb.com/public/ad1f406890f44fdd9fbb5c946134a7b5/ABB-Q3-2025-financial-information.pdf
- The ABB Q2 2025 Results Presentation can be found here: https://resources.news.e.abb.com/attachments/published/127767/en-US/15CDC0BE6575/ABB-Q2-2025-Presentation.pdf
- The ABB Q2 2025 Financial Information can be found here: https://library.e.abb.com/public/4ac21ed3c1af4118a5e7115e89205d10/ABB-Q2-2025-financial-information.pdf
- The ABB Integrated Report 2024 can be found here: https://library.e.abb.com/public/6fe759d28f0d4261b6c4a8ab21275fe3/ABB%20Integrated%20Report%202024.pdf
- The ABB Q4 2024 Full Financial Information can be found here: https://library.e.abb.com/public/daae2758e6a546efab24d3967aaa0f37/ABB-Q4-2024-financial-information.pdf
- The ABB Q4 2024 Group Results Presentation can be found here: https://library.e.abb.com/public/4e87bd89e0c541ed857d8085f22e7f61/ABB-Q4-2024-presentation.pdf
- The ABB Integrated Report 2023 can be found here: https://library.e.abb.com/public/8fe35c6a0c3943d5aacc783ce0ffaf3b/ABB%20Integrated%20Report%202023.pdf
- ABB Q4 2023 Full Financial Report can be found here: https://library.e.abb.com/public/9d87fae42fab43c297c4ee385296fd05/ABB-Q4-2023-financial-information.pdf
- ABB Q4 2023 Results Presentation Report can be found here: https://library.e.abb.com/public/0834f841fe5a4829bd9ce21ad23d8f70/ABB-Q4-2023_Group%20presentation.pdf
- ABB Q4 2022 Full Financial Report can be found here: https://library.e.abb.com/public/0c911f20f7cc46848b2e64bde82fb4f5/ABB-Q4-2022-financial-information.pdf
- ABB Q4 2022 Group Results Presentation can be found here: https://library.e.abb.com/public/63461737ba8345e3aa6d2461f06fc72d/ABB%20Q4%202022%20Group%20results%20presentation.pdf
- The ABB Integrated Report 2022 can be found here: https://library.e.abb.com/public/ef5852f1e2e54cad97abcc4fc48d1d58/Annual%20Reporting%20Suite_Integrated%20Report%202022_English.pdf
- The ABB Annual Report 2021 can be found here: https://library.e.abb.com/public/c6dae9af148d4d5fb87efc97bb4b460a/ABB-Group-Annual-Report-2021-English.pdf