Grainger – Grainger reports results for the third quarter 2025


- Continued execution fueling solid performance;
- Company narrows full year 2025 earnings outlook
Third Quarter Highlights
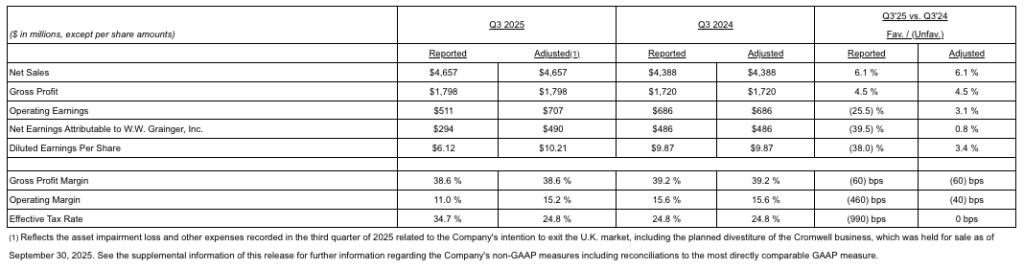
- Delivered sales of $4.7 billion, up 6.1%, or 5.4% on a daily, constant currency basis
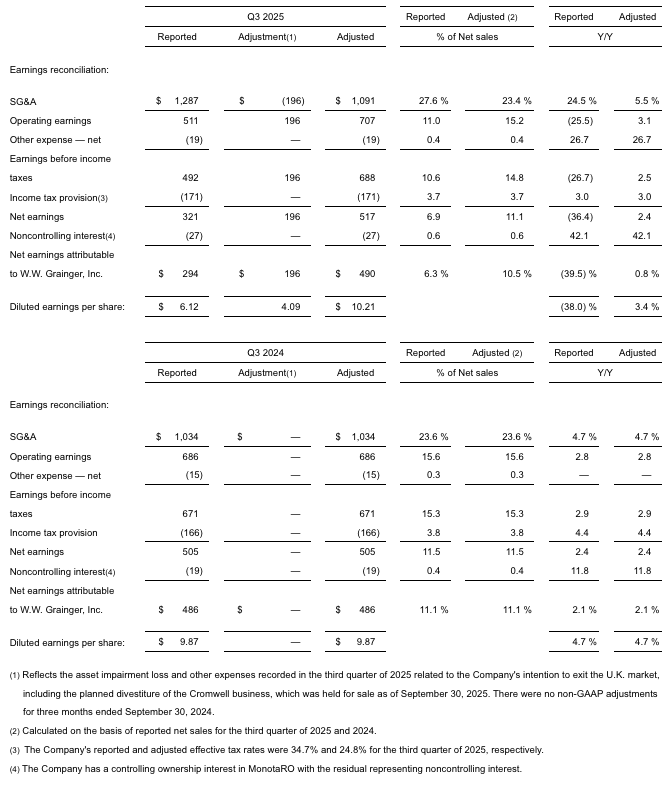
- Achieved operating margin of 11.0% on a reported basis, down 460 basis points, or 15.2% on an adjusted basis, down 40 basis points, which excludes the non-cash loss related to the Company’s intended exit of the U.K. market, including the planned divestiture of Cromwell
- Generated diluted EPS of $6.12 on a reported basis, down 38.0%, or $10.21 on an adjusted basis, up 3.4%
- Produced $597 million in operating cash flow and returned $399 million to Grainger shareholders through dividends and share repurchases
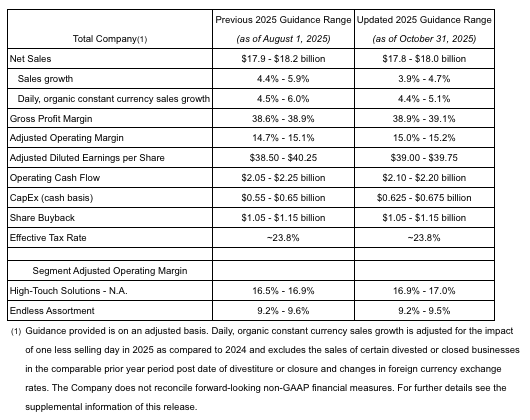
- Updating full year 2025 guidance, including a narrowed adjusted diluted EPS range of $39.00 to $39.75
CHICAGO, Oct. 31, 2025 /PRNewswire/ — Grainger (NYSE: GWW) today reported results for the third quarter of 2025 with sales of $4.7 billion, up 6.1%, or 5.4% on a daily, constant currency basis, and adjusted diluted EPS of $10.21, up 3.4% compared to the third quarter of 2024.
“We delivered results in-line with our expectations for the quarter, reinforcing the value and differentiated experience Grainger consistently creates for our customers,” said D.G. Macpherson, Chairman and CEO. “Looking ahead, we remain focused on navigating the continued uncertain environment through strong execution, industry-leading service and innovative capabilities to deliver on what matters most to our stakeholders.”
2025 Third Quarter Financial Summary
Revenue
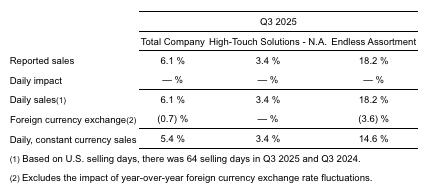
Sales in the quarter increased 6.1% compared to the third quarter of 2024. When normalizing for the impact of foreign currency exchange, sales on a daily, constant currency basis increased 5.4% compared to the third quarter of 2024.
In the High-Touch Solutions – N.A. segment, sales were up 3.4% on both a daily and constant currency basis compared to the third quarter of 2024. Results for the segment were driven by volume growth and improving price contribution as tariff costs are passed. In the Endless Assortment segment, sales were up 18.2%, or 14.6% on a daily, constant currency basis, compared to the third quarter of 2024. Growth for the segment was driven by strong performance at both MonotaRO and Zoro.
Gross Profit Margin
Gross profit margin was 38.6% in the third quarter of 2025, a decrease of 60 basis points from the third quarter of 2024.
In the High-Touch Solutions – N.A. segment, gross profit margin was 41.1%, a 50 basis point decrease compared to the prior year quarter as tariff-related inflation caused unfavorable price / cost timing and last-in, first-out (LIFO) inventory valuation headwinds. In the Endless Assortment segment, gross profit margin increased by 60 basis points from the third quarter of 2024 due to improvement across the segment.
Earnings
For the third quarter of 2025, total Company reported operating earnings were $511 million, down 25.5% compared to the third quarter of 2024. Reported operating margin was 11.0%, a 460 basis point decrease compared to the third quarter of 2024. On an adjusted basis, operating earnings for the quarter were $707 million, up 3.1% compared to the third quarter of 2024. Adjusted operating margin was 15.2%, a 40 basis point decrease compared to the third quarter of 2024. This decrease in adjusted operating margin was driven by unfavorable gross margin in High-Touch Solutions – N.A., which was partially offset by expense leverage in Endless Assortment. These adjusted results for the quarter exclude the asset impairment loss from the planned divestiture of the Cromwell business, along with other expenses related to the intended exit from the U.K. market incurred in the current year period.
Diluted earnings per share for the third quarter of 2025 were $6.12 on a reported basis, down 38.0% compared to the third quarter of 2024. On an adjusted basis, diluted EPS was $10.21, up 3.4% compared to the third quarter of 2024. The increase was driven primarily by sales growth and fewer shares outstanding.
Tax Rate
For the third quarter of 2025, the effective tax rate was 34.7%, compared to 24.8% in the third quarter of 2024. The increase in the effective tax rate was primarily due to the loss from the planned divestiture of the Cromwell business and intended exit from the U.K. market, for which there are no corresponding tax benefits. On an adjusted basis, the effective tax rate was 24.8% in both periods.
Cash Flow
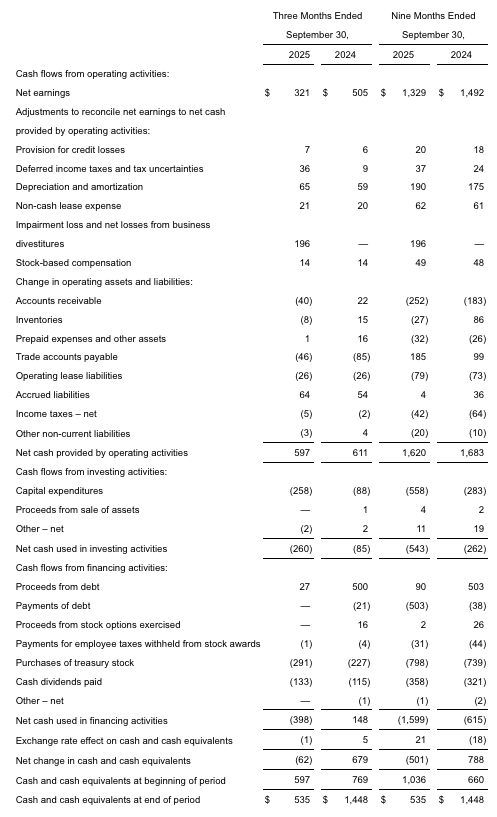
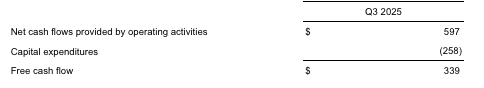
During the third quarter of 2025, the Company generated $597 million of cash flow from operating activities. The Company invested $258 million in capital expenditures, resulting in free cash flow of $339 million. During the quarter, the Company returned $399 million to Grainger shareholders through dividends and share repurchases.
Guidance
The Company is updating the following guidance ranges which include certain known tariff impacts.
Webcast
The Company will conduct a live conference call and webcast at 11:00 a.m. ET on Friday, October 31, 2025, to discuss the third quarter results. The event will be hosted by D.G. Macpherson, Chairman and CEO, and Deidra Merriwether, Senior Vice President and CFO, and can be accessed at invest.grainger.com. To access the conference call via phone, please send a request to InvestorRelations@grainger.com. For those unable to participate in the live event, a webcast replay will be available for 90 days at invest.grainger.com.
Safe Harbor Statement
All statements in this communication, other than those relating to historical facts, are “forward-looking statements.” Forward-looking statements can generally be identified by their use of terms such as “anticipate,” “estimate,” “believe,” “expect,” “could,” “forecast,” “may,” “intend,” “plan,” “predict,” “project,” “will,” or “would,” and similar terms and phrases, including references to assumptions. Grainger cannot guarantee that any forward-looking statement will be realized and achievement of future results is subject to risks and uncertainties, many of which are beyond Grainger’s control, which could cause Grainger’s results to differ materially from those that are presented. Forward-looking statements include, but are not limited to, statements about future strategic plans and future financial and operating results. Important factors that could cause actual results to differ materially from those presented or implied in the forward-looking statements include, without limitation: inflation, higher product costs or other expenses, including operational and administrative expenses; a major loss of customers; loss or disruption of sources of supply; changes in customer or product mix; increased competitive pricing pressures; changes in third-party practices regarding digital advertising; failure to enter into or sustain contractual arrangements on a satisfactory basis with group purchasing organizations; failure to develop, manage or implement new technology initiatives or business strategies including with respect to Grainger’s eCommerce platforms and artificial intelligence; failure to adequately protect intellectual property or successfully defend against infringement claims; fluctuations or declines in Grainger’s gross profit margin; Grainger’s responses to market pressures; the outcome of pending and future litigation or governmental or regulatory proceedings, including with respect to wage and hour, anti-bribery and corruption, environmental, regulations related to advertising, marketing and the internet, consumer protection, pricing (including disaster or emergency declaration pricing statutes), product liability, compliance or safety, trade and export compliance, general commercial disputes, or privacy and cybersecurity matters; investigations, inquiries, audits and changes in laws and regulations; failure to comply with laws, regulations and standards, including new or stricter environmental laws or regulations; government contract matters; the impact of any government shutdown; disruption or breaches of information technology or data security systems involving Grainger or third parties on which Grainger depends; general industry, economic, market or political conditions; general global economic conditions, including existing, new, or increased tariffs, trade issues and changes in trade policies, inflation, and interest rates; currency exchange rate fluctuations; market volatility, including price and trading volume volatility or price declines of Grainger’s common stock; commodity price volatility; facilities disruptions or shutdowns; higher fuel costs or disruptions in transportation services; effects of outbreaks of pandemic disease or viral contagions, global conflicts, natural or human induced disasters, extreme weather, and other catastrophes or conditions; effects of climate change; failure to execute on our efforts and programs related to environmental, social and governance matters; competition for, or failure to attract, retain, train, motivate and develop executives and key team members; loss of key members of management or key team members; loss of operational flexibility and potential for work stoppages or slowdowns if team members unionize or join a collective bargaining arrangement; changes in effective tax rates; changes in credit ratings or outlook; Grainger’s incurrence of indebtedness or failure to comply with restrictions and obligations under its debt agreements and instruments and other factors that can be found in our filings with the Securities and Exchange Commission, including our most recent periodic reports filed on Form 10-K and Form 10-Q, which are available on our Investor Relations website. Forward-looking statements are given only as of the date of this communication and we disclaim any obligation to update or revise any forward-looking statement, whether as a result of new information, future events or otherwise, except as required by law.
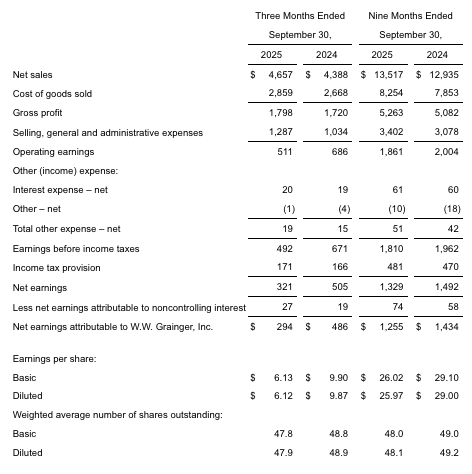
W.W. Grainger, Inc. and Subsidiaries
CONDENSED CONSOLIDATED STATEMENTS OF EARNINGS
(In millions of dollars, except for share and per share amounts)
(Unaudited)
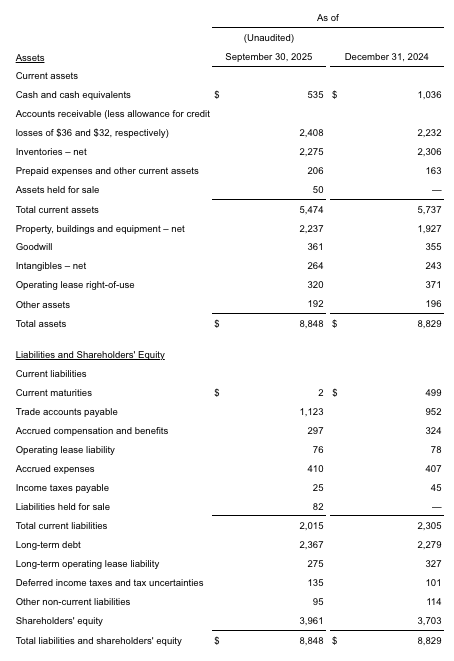
W.W. Grainger, Inc. and Subsidiaries
CONDENSED CONSOLIDATED BALANCE SHEETS
(In millions of dollars)
(Unaudited)
W.W. Grainger, Inc. and Subsidiaries
CONDENSED CONSOLIDATED STATEMENTS OF CASH FLOWS
(In millions of dollars)
(Unaudited)
SUPPLEMENTAL INFORMATION – RECONCILIATION OF GAAP TO NON-GAAP
FINANCIAL MEASURES (Unaudited)
The Company supplements the reporting of financial information determined under U.S. generally accepted accounting principles (GAAP) with the non-GAAP financial measures as defined below. The Company believes these non-GAAP financial measures provide meaningful information to assist investors in understanding financial results and assessing future performance as they provide a better baseline for analyzing the ongoing performance of its business by excluding items that may not be indicative of core operating results.
Basis of presentation
The Company has a controlling ownership interest in MonotaRO, which is part of our Endless Assortment segment. MonotaRO’s results are fully consolidated, reflected in U.S. GAAP, and reported one-month in arrears. Results will differ from MonotaRO’s externally reported financials which follow Japanese GAAP.
Adjusted gross profit, adjusted SG&A, adjusted operating earnings, adjusted operating margin, adjusted net earnings, adjusted diluted EPS
Exclude certain non-recurring items, like restructuring charges, asset impairments, gains and losses associated with business divestitures and other non-recurring, infrequent or unusual gains and losses (together referred to as “non-GAAP adjustments”), from the Company’s most directly comparable reported U.S. GAAP figures (reported gross profit, SG&A, operating earnings, net earnings and EPS). The Company believes these non-GAAP adjustments provide meaningful information to assist investors in understanding financial results and assessing future performance as they provide a better baseline for analyzing the ongoing performance of its business by excluding items that may not be indicative of core operating results.
Free cash flow (FCF)
Calculated using total cash provided by operating activities less capital expenditures. The Company believes the presentation of FCF allows investors to evaluate the capacity of the Company’s operations to generate free cash flow.
Daily sales
Refers to sales for the period divided by the number of U.S. selling days for the period.
Daily, constant currency sales
Refers to daily sales adjusted for changes in foreign currency exchange rates.
Daily, organic constant currency sales
Refers to daily sales excluding the sales of certain divested or closed businesses in the comparable prior year period post date of divestiture or closure and changes in foreign currency exchange rates.
Foreign currency exchange
Calculated by dividing current period local currency daily sales by current period average exchange rate and subtracting the current period local currency daily sales divided by the prior period average exchange rate.
U.S. selling days:
2024: Q1-64, Q2-64, Q3-64, Q4-64, FY-256
2025: Q1-63, Q2-64, Q3-64, Q4-64, FY-255
2026: Q1-63, Q2-64, Q3-64, Q4-64, FY-255
As non-GAAP financial measures are not standardized, it may not be possible to compare these measures with other companies’ non-GAAP measures having the same or similar names. These non-GAAP measures should not be considered in isolation or as a substitute for reported results. These non-GAAP measures reflect an additional way of viewing aspects of operations that, when viewed with GAAP results, provide a more complete understanding of the business. This press release also includes certain non-GAAP forward-looking information. The Company believes that a quantitative reconciliation of such forward-looking information to the most comparable financial measure calculated and presented in accordance with GAAP cannot be made available without unreasonable efforts. A reconciliation of these non-GAAP financial measures would require the Company to predict the timing and likelihood of future restructurings, asset impairments, and other charges. Neither of these forward-looking measures, nor their probable significance, can be quantified with a reasonable degree of accuracy. Accordingly, a reconciliation of the most directly comparable forward-looking GAAP measures is not provided.
The reconciliations provided below reconcile GAAP financial measures to non-GAAP financial measures used in this release: daily sales; daily, constant currency sales; and free cash flow.
Sales growth for the three months ended September 30, 2025
(percent change compared to prior year period)
(unaudited)
Free cash flow (FCF) for the three months ended September 30, 2025
(in millions of dollars)
(unaudited)
Income statement adjustments for the three months ended September 30, 2025 and 2024
(in millions of dollars)
(unaudited)
SourceGrainger
EMR Analysis
More information on Grainger: See the full profile on EMR Executive Services
More information on D.G. Macpherson (Chairman and Chief Executive Officer, Grainger): See the full profile on EMR Executive Services
More information on Deidra C. Merriwether (Senior Vice President and Chief Financial Officer, Grainger): See the full profile on EMR Executive Services
More information on Cromwell by Grainger: https://www.cromwell.co.uk/+ It started with one man’s ambition to be the most reliable, local tool supplier. More than 50 years later, we’re still looking after our customers, supplying the essential components that keep their operations running and their people safe.
Every year we deliver over half a million products to thousands of businesses throughout the UK, using our own fleet of drivers.
We supply all the trusted brands our customers love, as well as our own exclusive products that are quality tested to meet the demands of industry.
When customers have questions, they can speak to a real person based in the UK. For support with operations, our team of time-served engineers are ready to step in with technical advice that saves our customers money.
It all adds up to excellent customer care.
Cromwell has been acquired by Grainger in 2015.
More information on Neil Jowsey (Managing Director, Cromwell, Grainger): https://www.cromwell.co.uk/info/leadership + https://www.linkedin.com/in/neiljowsey/
More information on Zoro.com by Grainger: See the full profile on EMR Executive Services
More information on Sandy Mattinson (President, Zoro, Grainger): See the full profile on EMR Executive Services
More information on High-Touch Solutions by Grainger: See the full profile on EMR Executive Services
EMR Additional Financial Notes:
- All members of the Executive Committee and of the Board have their full profile on EMR Executive Services
- Major financial KPI’s since 2017 are available on EMR Executive Services under “Financial Results” and comparison with peers under “Market Positioning”
- Companies’ full profile on EMR Executive Services are based on their official press releases, quarterly financial reports, annual reports and other official documents like the Universal Registration Document.
- All members of the Executive Committee and of the Board have their full profile on EMR Executive Services
- The Grainger Q3 2025 Earnings Call Presentation is available here: https://s1.q4cdn.com/422144722/files/doc_financials/2025/q3/2025-Q3_Earnings-Presentation_FINAL-PDF.pdf
- The Grainger Q3 2025 Earnings Infographic is available here: https://s1.q4cdn.com/422144722/files/doc_financials/2025/q3/Q3-2025_Grainger_Earnings_Infographic_FINAL.pdf
- The Grainger Investor Presentation (updated September 2025) is available here: https://s1.q4cdn.com/422144722/files/doc_presentations/2025/Sep/05/2025-September_GWW-Investor-Presentation-vFinal.pdf
- The Grainger Q2 2025 Earnings Call Presentation is available here: https://s1.q4cdn.com/422144722/files/doc_earnings/2025/q2/presentation/2025-Q2_Earnings-Deck-Final.pdf
- The Grainger Q2 2025 Earnings Infographic is available here: https://s1.q4cdn.com/422144722/files/doc_earnings/2025/q2/earnings-result/Q2_2025_Earnings_Infographic-Final.pdf
- The Grainger Annual Report 2024 is available here: https://s1.q4cdn.com/422144722/files/doc_financials/2024/ar/2024-GWW-Annual-Report.pdf
- The Grainger Q4 2024 and Full Year Earnings Presentation is available here: https://s1.q4cdn.com/422144722/files/doc_earnings/2024/q4/presentation/2024-Q4_Earnings-Deck-Final.pdf
- The Grainger Q4 2024 Earnings Infographic is available here: https://s1.q4cdn.com/422144722/files/doc_earnings/2024/q4/earnings-result/Q4_2024_Earnings_Infographic-Final.pdf
- The Grainger Annual Report 2023 is available here: https://s1.q4cdn.com/422144722/files/doc_financials/2023/ar/grainger-2023-ar10k.pdf
- The Grainger Q4 and Full Year 2023 Earnings Presentation is available here: https://s1.q4cdn.com/422144722/files/doc_earnings/2023/q4/presentation/2023-Q4_Earnings-Deck-Final.pdf
- The Grainger Q4 2023 Earnings Infographic is available here: https://s1.q4cdn.com/422144722/files/doc_earnings/2023/q4/earnings-result/Q4_2023_Earnings_Infographic-Final.pdf
- The Grainger Q4 2022 Earnings Presentation is available here: https://s1.q4cdn.com/422144722/files/doc_financials/2022/q4/2022.Q4_Earnings-Deck-vFINAL.pdf
- The Grainger Annual Report 2022 is available here: https://s1.q4cdn.com/422144722/files/doc_financials/2022/ar/updated/Grainger-2022-AR10K.pdf